Binance Coin (BNB): Possible Break of Structure!Binance coin is having some kind of rejection from the upper resistance zone (white zone).
As we had our first small rejection, we will not consider it a full rejection as the candle is yet to be closed.
So here we are with two possible scenarios that we see:
The first would be where the price closes below resistance and moves for a break of the structure zone.
The second one would be where we break from the white zone and move towards major resistance + EMAs, where we will be looking for strong rejection!
Swallow Team
BNBUSDT trade ideas

Binance Coin Is Approaching An Important Resistance ZoneHey Traders, in today's trading session we are monitoring BNBUSDT for a selling opportunity around 560 zone, Binance Coin is Trading in a downtrend and currently is in a correction phase in which it is approaching the trend at 560 support and resistance area.
Trade safe, Joe.

BNB trendBNB is one the best crypto ever...
It can touch 900$ and the blue box can be a good area for buying BNB...

BNB/USDT Short-TermHello everyone, I invite you to a quick review of the BNB to USDT chart, taking into account the one-hour interval.
Taking into account the short time interval, we will first determine possible stop losses:
SL1: $501,
SL2: $487,
SL3: $477,
SL4: $464.
Looking the other way, we will determine the closest to the targets:
T1: $517,
T2: $530,
T3: $547.
The RSI indicator shows a rebound, but there is still more room for a decline than for the current upward movement.

I think $BNB is not so bullish in short term#binance coin #bnb price is now moving inside the ascending channel after the dump. The structure seems not so strong. Not financial advice.

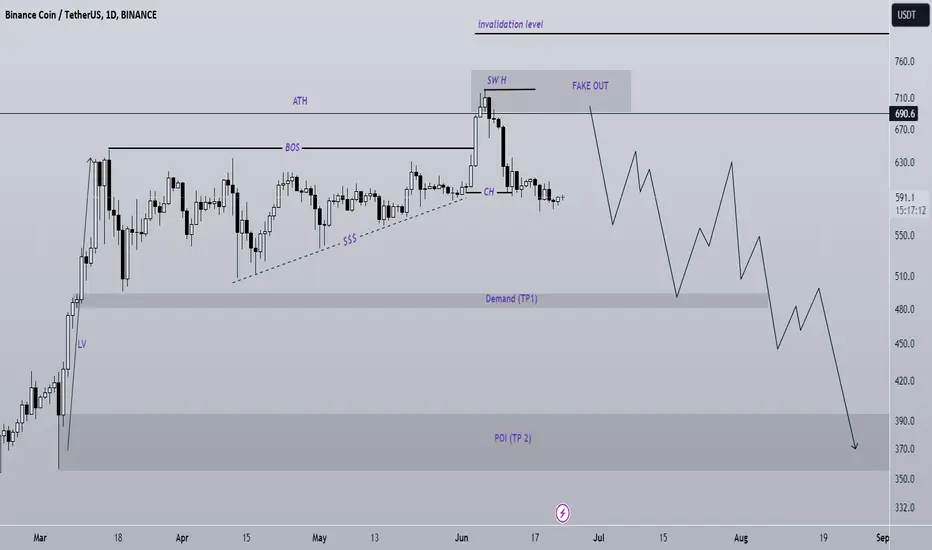
BNB is bearish for the MID-TermIt went above ATH but could not stabilize above ATH.
Below the price there is the liquidity pool and Liquidity Void. It is expected that the price will soon sweep these liquidity.
We specified the targets on the chart.
Closing a daily candle above the invalidation level will violate the analysis
Note that the financial market is risky, so:
Do not enter any position without confirmation and trigger.
Do not enter a position without setting a stop.
Do not enter a position without capital management.
When we reach the first TP, save some profit and try to move the stop continuously in the direction of your profit.
If you have any comments please post them, comments will help us improve our performance
Thanks

Binance Coin BD-Pot 38% Without Lev. (Up To 3,800% with 100X)This is what Binance Coin (BNBUSDT) looks like on the weekly timeframe... Absolutely terrible.
➖ First, we have the full negation after the major fakeout move; this is a strong bearish signal in and of itself.
➖ Then, we have confirmation with the red candle that follows it (17-June).
➖ Last weeks candle closed green with a lower wick and looks like a recovery but...
➖ This week is now trading full red and almost below last week wicks low... This is the worst possible scenario when it comes to technical analysis based on candlestick reading.
This whole situation can result in a major crash .
The good news?
👉 After the initial, negative marketwide reaction, money flowing out of these big projects will flow to thousands of the smaller projects; an altcoins market boom!
Namaste.


Today's Analysis: Bitcoin and BNB📅Today, the market, after experiencing a dip, is in a ranging phase. We can expect the next wave of decline to begin after this correction and rest period. The coin I want to analyze today is BNB, but as always, let's start with Bitcoin.
👑 Bitcoin Analysis
🔍 1-Hour Time Frame Analysis
In the 1-hour time frame, Bitcoin has corrected to 58516 and then started to decline. In recent candles, significant selling volume has entered the market. The price has also pulled back to the SMA99 and is now consolidating below the 0.382 Fibonacci level. RSI has triggered at 44.10. The next trigger is 56045, and if a candle closes below this level, we can target 53921 again.
📈 Long Position
For a long position, the market structure still doesn't seem favorable. However, if you insist on opening a long position, 58516 can be a suitable trigger. As mentioned, I won't open a long position until a suitable structure forms.
📉 Short Position
The next trigger for a short position is 56045. I will wait for the price to react to this level once, and on the next attempt, if it breaks, I'll open a position. The trigger at 57033 has slightly shifted, and now we can open a position if 56693 is broken, though the target for this position is smaller than the target for the 56045 trigger.
📊 Volume Analysis
If the market declines, the volume of red candles should increase. If not, I will open the position with lower volume and risk since volume and momentum are crucial when opening a position.
🔍 BNB Analysis
🗂 Binance Overview
Binance is one of the top crypto exchanges, handling the majority of crypto trading volume and being the most reputable exchange for traders. In addition to its trading platform, Binance also has its own blockchain with BNB as the main coin. All activities on this blockchain are conducted using BNB, which has secured the 4th position in market cap after Bitcoin, Ethereum, and Tether.
🧩 Daily Time Frame Technical Analysis
In the daily time frame, as seen, after forming an ascending triangle and breaking resistance at 619, BNB couldn't hold above this level, resulting in a fake breakout and a return to the box. The trigger for confirming the fake breakout was at 591. Currently, the price has reached the support level at 499, which aligns with the 0.382 Fibonacci level. If this level is broken, the next targets are 450$ and 390$.
📊 Volume Analysis for BNB
The volume of red candles is currently much higher than green ones, indicating strong downward momentum. However, due to the selloff candle two days ago, the market might rest for a few days before deciding whether to continue the HWC uptrend or start a correction.
🛒 Spot Buying Strategy
For buying BNB in spot, I don't recommend it while the market has downward momentum, unless a daily or weekly candle closes above 619. In my opinion, waiting for the market to form a new structure can provide better entry points.
📝 Conclusion
Both Bitcoin and BNB are at critical points. Bitcoin continues to show signs of a downtrend, and BNB is trying to stabilize at significant support levels amid strong selling pressure. Wait for the necessary confirmations before entering positions and closely monitor volume and momentum.
🧠💼 Always remember that trading futures involves inherent risks, and improper risk management can lead to margin calls. Stick to your capital management principles and use stop-loss orders, aiming for an initial risk-to-reward ratio of 2.
🫶 If you found this analysis helpful and want to support me, please like and share this analysis. Feel free to leave your comments or suggest a coin you'd like me to analyze next.

Short trade Sun 7th July 24
9.30am
LND Session to NY - AM
Entry 30min TF
RR 45.31
Entry 503.90
Profit level 486.23 (3.51%)
Stop level 504.29 (0.08%)

#BNBUSDT Falls By 20% To Hug The 200 MAThe BINANCE:BNBUSDT pair experienced a fall in price from $580 to $455 between July 3 and July 5, a 20% decrease in price following the Mt. Gox releasing $9 billion worth of BTC resulting in over $100M of leveraged positions getting liquidated.
The bears pushed the price into the oversold territory which is the reason for the price rebound to $530. If the 200 MA that is currently holding the price up cracked, the bears can push the price back to $455 and from there to $396 and $340.
But this depends heavily on the overall crypto market's performance, if the market conditions improved and the price stayed above the 200 MA the next resistance would be $590, $622, $637, $670 and $720.


Long trade 2min TF entry
15min TF Overview
Buyside 5.54am LND Session
RR 2.9
Entry 510.19
Profit level 515.26 (0.99%)
Stop level 508.44 (0.34%)
Target liquidity high - buyside sweep
Points - 1 to 5
Inverse head and shoulder pattern

BNB/USDT BNB key support and resistance levels, keep an eye on these low and buy on support and sell at resistance level.

BNBUSDT.1DAnalyzing the BNB/USDT daily chart, I observe key aspects that delineate the current technical posture and potential future movements of the asset.
Technical Analysis Observations:
Support and Resistance Levels (S1, S2, R1, R2):
Support Level 1 (S1) at $359.5 acts as the immediate floor for the price. This level previously functioned as a strong support, suggesting a potential area where buyers might re-enter.
Support Level 2 (S2) at $202.0 represents a significant historical support level and a crucial psychological barrier.
Resistance Level 1 (R1) at $521.2 and Resistance Level 2 (R2) at $644.8 serve as key thresholds that the price must surpass to confirm any bullish momentum.
Trend Indicators:
The green trend line, ascending from the left lower corner, has been acting as a dynamic support. A break below this line could signal a shift in the underlying bullish sentiment to bearish.
RSI (Relative Strength Index):
The RSI is currently at 24.80, well into the oversold territory. This suggests that the asset may be underbought, potentially setting the stage for a bullish reversal if other conditions align.
MACD (Moving Average Convergence Divergence):
The MACD is below the signal line, and both are trending downwards, indicating strong bearish momentum. The spread between the MACD and the signal line, along with a deepening histogram, further confirms the bearish sentiment.
Conclusion:
From my analysis, BNB/USDT is currently in a precarious position, hovering near a critical support level at $359.5, underpinned by an oversold RSI. This suggests a possible area for a reversal; however, the prevailing bearish momentum highlighted by the MACD advises caution.
Potential strategies could include preparing for a buying opportunity if a bullish reversal signal is observed at the support level, especially if there is a bullish crossover in the MACD or an upturn in the RSI above the oversold region. Conversely, a break below $359.5 could open the door to further declines towards $202.0, in which case, defensive strategies such as stop-loss orders would be crucial.
Investors should remain vigilant, watching for increased volume or news that could influence price action. As always, it's critical to complement technical analysis with sound risk management practices to mitigate potential losses in such a volatile environment.

BNBUSDT. Trading opportunityOn the daily timeframe, the sideways movement that began in March continues. Yesterday, the seller pushed the price back below the upper boundary of the range at 645.2. The closing candle had a good spread and volume, confirming the seller's strength. The current seller's vector is 9-10, with a potential target at 508. The nearest obstacle for the seller is at 586.5. The price is close to 50% of the last buyer's impulse (608.8), from which a buyer's movement might start.
On the hourly timeframe, there is a short-term downtrend. The last seller's impulse started at 653.7, and a seller's zone has formed at the base of this impulse (indicated by the red rectangle on the chart). It is preferable to look for selling opportunities in this seller's zone (645-654). However, the price may not return to this zone.
Currently, selling opportunities can be sought if the seller defends the level of 645.2, as an idea to realize the seller's vector 9-10 within the daily timeframe range.
There is no context for buying at the moment.

BNB BNB created triangle pattern and breakout up side. But actually BNB collecting up side triangle liquidity and moved down. So It's a BullTrap. Currently collecting triangle downside liquidity. So mitigate this orderblock (1) and moving up side is high possible.

BNB about to loss support ? BNB / USDT
After a major coin like BNB makes a new ATH then doing a clear and simple retest like this in which giving the majority the chance to buy it = 90% of cases is dump
In 90% of cases of retested triangles after new ATH = more dump to take more liquidity below the triangle
(Ex : this happens in BTC as well recently)
Iam long term supporter of BNB but short term looks more for correction
The confirmation :losing the dynamic support in my chart
This isn’t a Financial advice

IS THE SELL GOING TO CONTINUE WITH TO 540 ZONE?The recent sell trigger in the crypto market has been significant in all assets. While Solana was able to make some push.
I feel the BNB may sell to around the $540 zone.

BNB BNB failed in order block (3) and moved down and closed Bos line. This order block (3) is last support zone. This zone failed. So BNB clearly was bearish.
Order block (1) is next resistance zone. So BNB moving down is possible.

BNB BNB mitigated this orderblock (2) and moved down. Order block (1) was failed. This order block (1) is support zone. This zone failed.
Currently sweep the Ch line. If BNB closed the Ch line, the up trend changed to down trend.
Order block (3) is last support zone.

Binance Coin (BNB): Rejected From 100 EMAWe are back with BNB coin, where we had a nice rejection from 100 EMA in a 4-hour timeframe.
We are now looking for a touch to the support zone to happen after what we want to see: a nice movement towards the liquidity zone (which will happen only if we see a clean break from support).
Swallow Team
