BNBUSDT Elliott wave countAfter hitting 1.618 fib extension of wave ((i)) below 721.8 we are looking to the downside for wave ((iv)).
Possible target 0.236 fib retracement of wave ((iii)) in the span of previous wave (iv).
We are not excluding one more leg up above 721.8.
BNBUSDT trade ideas

BNB: analaysis in D1📊Analysis by AhmadArz:
According to the flag pattern that we saw the best reactions in the past, we can expect the same analysis from the chart at this time.🧨
Just keep in mind that there is a 10% chance of a fake breakout on each side of this horizontal trend.🚨
🔗"Uncover new opportunities in the world of cryptocurrencies with AhmadArz.
💡Join us on TradingView and expand your investment knowledge with our five years of experience in financial markets."
🚀Please boost and💬 comment to share your thoughts with us!

BNB BNB sweep the swing high (💀) to moving downside and holding this order block (3). If this order block was fail, BNB was moving downside.
Order block (1) is next resistance zone. So some downside possible.

Binance Coin Ascending Channel Breaks; $372 Next Target➖ We have a very strong ascending channel pattern on the BNBUSDT chart.
➖ The fake bullish breakout early June is a failed signal.
These two combined spell doom for this pair.
Expect a major crash to happen now, after months of sideways which is when most traders lose money. Once a trend has been established, it is easy for traders to win. When the market is ranging, most people lose money and that's when it is recommended to stay out; exactly what we did.
👉 A move down is starting to develop; targets follow:
1) $475 is a strong support.
2) $372 goes next.
These are high probability targets.
It seems the recovery will be fast after the crash.
Namaste.

BNB BNB sweep the order block (2) to moving downside. Order block (3) Is next buyside orderblock.
But order block (3) was not high probability. Because BNB was bearish. Maybe mitigate order block (3) to moving some upside movements possible.

✴️ Binance Coin Still Bearish; Short-Squeeze = 50% Drop!Notice that this is the same chart setup we used before; Binance Coin bearish potential remains intact.
The bearish potential is intact because BNBUSDT is still moving within a lower high compared to 16-March.
Notice that the peak is very close to Bitcoin's; What one does, the rest follows!
We do have a volume breakout in the last two days and the MACD looks good but the volume is too low. (Mixed signals.)
Here we might be too early but we have the other pairs as confirmation and the fact that this was a very strong and sudden move...
Let's make it simple:
➖ Bearish below $650; bullish above.
👉 As long as BNBUSDT trades below $650 monthly, remain short.
👉 If BNBUSDT moves and closes above $650 on the monthly timeframe, we have to reconsider our bias and adapt to the chart and market.
But right now the chart setup remains the same.
Namaste.

BNBUSDT.1DIn this technical analysis of the BNB/USDT chart, we explore the recent price movements and key technical indicators to derive insights into potential future price actions.
Key Observations:
Current Price and Movement:
BNB/USDT is currently priced at $594.6, with a modest daily decline of 0.78%. This movement suggests a potential consolidation phase after recent price activities.
Support and Resistance Levels:
R1 (Resistance Level 1): $644.8 - This level marks a critical resistance point that BNB needs to surpass to confirm a bullish trend continuation.
S1 (Support Level 1): $494.3 - This is the primary support that BNB might retest if the current price level fails to hold.
S2 (Support Level 2): Indicated on the chart but not specifically quantified, it represents a deeper support level that could come into play during a significant pullback.
Technical Indicators:
MACD (Moving Average Convergence Divergence): The MACD line is above the signal line, which typically suggests bullish momentum. However, the proximity of these lines indicates that the bullish strength might be waning.
RSI (Relative Strength Index): The RSI is near 49.85, around the mid-range, which indicates neither overbought nor oversold conditions, suggesting a balance in buying and selling pressures.
Analysis and Conclusion:
BNB/USDT is currently navigating through a critical juncture, as evidenced by the consolidation pattern near the $594.6 level and the approach towards a significant resistance at $644.8. The MACD shows a slight bullish tendency, but the closeness of the MACD and signal lines could imply potential shifts in momentum.
In the short term, the ability of BNB to hold above the support at $494.3 will be vital for sustaining the current market sentiment. Should this level hold, it could provide the necessary stability for BNB to attempt breaking past the resistance at $644.8. Conversely, a break below $494.3 could lead to a test of deeper supports (S2), indicating a shift towards a bearish trend.
Traders should keep a close eye on these technical levels and indicators. The consolidation pattern, combined with MACD and RSI readings, will provide clues on the likely direction of the next significant price move. Given the current balanced RSI, the market could tilt in either direction based on broader market sentiment or specific news impacting Binance or the broader crypto market. As always, incorporating stop losses and managing risk exposure will be crucial in navigating the potentially volatile movements of BNB/USDT.

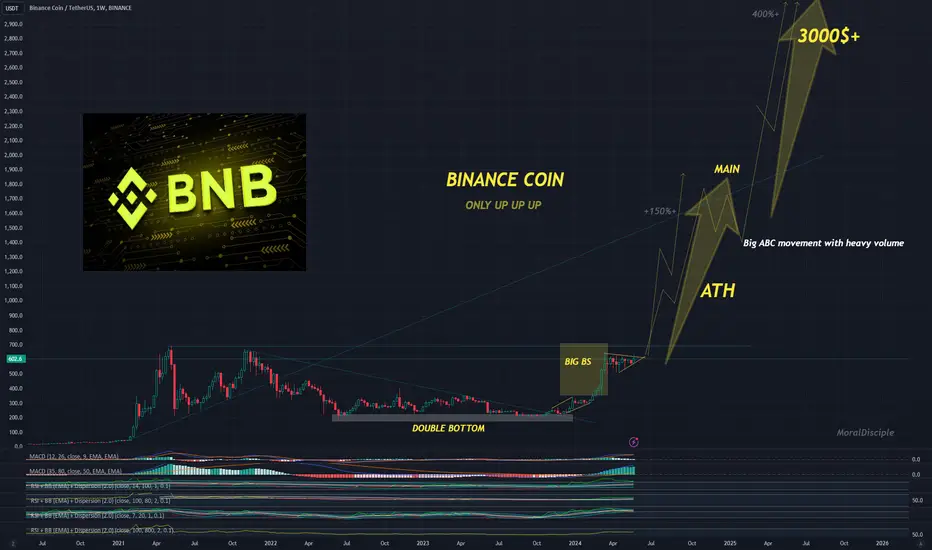
BNB worth of investing?BNB (BNB) is definitely coin worth of investing because of their exchange and all projects on BNB Chain. This is trade (investment) setup on larger timeframe. I am not looking to reach targets 2,3 and 4 very soon, that could be year(s). I will sell most of my capital on targets 3 and 4. Small portion will be sold on Target 1 and 2.
Entry Zone: 249-296
Buy Zone 2: 108-147
Target 1: 435 – 480 (48%)
Target 2: 633 - 684 (112%)
Target 3: 1026 -1087 (243%)
Target 4: 1430 - 1470 (377%)

Binance Coin Analysis: Bulls in controlBNB just made a new ATH in the recent month, and now I expect a slight correction before it rockets to new highs. The main support I have in mind is around $456, with the main target at $1,570 and an optimistic target at $2,040

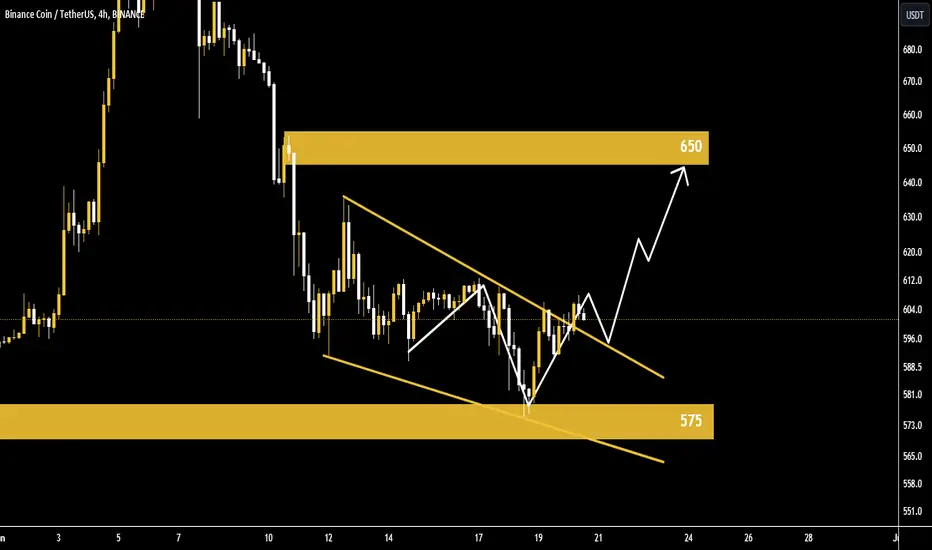
Is Binance Coin Breaking Out of its Bearish Pattern?📊 According to the buying pressure in the market, if the $610 range is broken and the price stabilizes above it, the price may increase to the $625 range🎯, and in the case of strength, the $650 range🎯🎯.
📊 Otherwise, the price may fall to the range of $575.
BNBBNB mitigating orderblock (2) to moving downside. Currently facing order block (3).
BNB was bearish. But the chart showing some upside rally possible.
If order block (3) was fail, BNB moving downside. If order block (2) was fail, BNB moving upside and taking Inducement (💎) to moving downside is high possible.

Binance Coin (BNB): Possible Crash of BNB/USDTBinance coin is back inside that tight triangle formation after forming a fake breakout attempt on the upper zones.
As we are back at the formation, we are now looking at both 100 and 200 EMAs, which are the next zones that will be re-tested.
As soon as we break down from the formation, we might enter a freefall zone!
Swallow Team

BNB MonthlyBullflag & restest of M value areas,beneath M POC.BNB is trying to find acceptance in the entire Value Area of the M Bullflag.
It took out most of the break out levels stops and is now back in the that range,
5 m falling wedge into 5 OS for an H HL was my attempt but got stopped out.
I got stopped out of my M SWING the last few days.
attempting a daytrade reentry with clear stops under this H level.
next is 15 OS for a 4h HL .
next is BTC D OS and then try BNB for a M bullfalg reattempt into summer.

Binance Coin is nearing 540 support zoneHey Traders, in today's trading session we are monitoring BNBUSDT for a buying opportunity around 540 zone, BNB is trading in an uptrend and currently is in a correction phase in which it is approaching the trend at 540 support and resistance area.
Trade safe, Joe.

BNBUSDTBNB analysis
Weekly and 12-hour timeframe
I expect the price to move towards higher targets after the correction to the 12-hour supply area. If I lose the 12-hour demand area, I expect the price to return from the weekly demand area.

Long trade Mon 8th June 24
13.30pm
New York Session
Entry 605.02
Profit level 612.17 (1.18%)
Stop level 602.03 (0.49%)
RR 2.39

Long trade
Observation
10th Jun 24
Downside trend anticipated
to bounce at 598.05 Support level
1Hr TF
New York Session
Entry 676.51
Profit level 676.51 (13.12%)
Stop level 584.87 (2.20%)
RR 5.35

BNB: Pullback in UptrendTrade setup : Price is in an Uptrend. It broke out of an Ascending Triangle and above it's ATH of $692 from May 2021. It reached $720 but got overbought (RSI ~ 80) and pulled back on some profit taking. This pullback near $600 level is an attractive swing trade entry in Uptrend with +15% upside potential back to $700. Stop Loss (SL) level at $580, just below prior swing low.
Pattern : Pullback in Uptrend. Price remains in an Uptrend but has pulled back, which could present a 'buying dip' opportunity. Traders should look for the nearest support level where price could stabilize and resume its Uptrend. This support level could be a level where price bounced off of in the past, or a level that was previously resistance. (concept known as polarity).Learn to trade key levels in Lesson 3.
Trend : Short-term trend is Down, Medium-term trend is Strong Up and Long-term trend is Strong Up.
Momentum is Bearish ( MACD Line crossed below MACD Signal Line) BELOW days ago. Price is neither overbought nor oversold currently, based on RSI-14 levels (RSI > 30 and RSI < 70).
Support and Resistance : Nearest Support Zone is $500.00. Nearest Resistance Zone is $720.00.

Buy bnb right now If you look at the bugger picture you would notice bnb is still in an uptrend movement.
It got to my order block.
I went down to my 15 minute time frame for a change of structure to the upside.
I did set an order block also on 15 minute when it got there my order got executed so right now am on buy.

A sad story for crypo is right around the cornerFrom my previous post where I started out having a bullish tunnel vision it actually ended up with me continuing to short bitcoin and make a really good ROI. Now that bitcoin has been gotten rejected from a strong resistance zone and has also created a big descending triangle I think BTC is ready to rip to the downside. It is currently backtesting the resistance zone from the descending triangle but when it is ready to continue the pattern I think we will go down fast. The next support zone will then be between roughly 57-59k USD. That would be a 10% drop and in my opinion it could be the beginning of the bear market already. According to pattern recognisation and fractals it is fully possible that we will see that 70-80-90% drop much earlier than previously thought. The RSI on weekly is extremely overbought and the MACD has also flipped bearish here. This is signs we should take to consideration when trading btc.
Whatever happens with bitcoin I will try to make my own profits by shorting BNB since it both follows the same principles and it is known that most of the other coins follow the bitcoin price in some sort of way. The technicals are looking beautiful for shorting BNB as it looks right now. We are getting a rejection from a key resistance level on the weekly, the MACD has just flipped bearish and the RSI has been extremely overbought here too. I think it is very likely that we will move rapidly towards the 180-260 USD support zone. Some consolidation down at this level would also be good to look at. That is at least what happened last time we dropped down there.
Whatever happens I will make sure to risk free my trades and move the stop loss downwards as the price moves down. As long as it is technically possible.
I also think gold soon will lose a lot of its value but I will write that in another post.
Have fun trading guys and thanks for sharing your opinions!

BNB Price update
The price of BNB is testing the trend line. If the price breaks out from the $630.3 level we might see that the price could climb to the previous all-time high.
If the trend line did not hold the price we might see it can test the lows at $462.5 zone.
Despite the Red Market, we are not bearish.
It's Bull Run, and we are bullish

BNBUSDT.1DIn this professional analysis of the Binance Coin (BNB)/USDT daily chart on Binance, we are examining the key technical indicators and price structures that may affect the future price movements of BNB.
Price Action and Support/Resistance Levels
The current price of BNB stands at approximately $594.1. The chart presents a structured view with key resistance (R2) and support levels (S1, S2, S3, S4) defined. The highest recent resistance is marked at $724.1 with the latest price falling below this peak. The primary support levels are indicated at $625.5, $498.2, and $398.5, which help in identifying potential bounce-back points or areas where price might consolidate.
Technical Indicators
MACD (Moving Average Convergence Divergence): The MACD line is below the signal line and close to zero, suggesting a decrease in momentum and a potentially bearish outlook in the short term. The negative histogram further indicates that the bearish momentum could be increasing.
RSI (Relative Strength Index): The RSI is slightly below 60, which indicates a somewhat bullish momentum but nearing neutral territory. This suggests that while the market is not excessively overbought, there is also no strong bullish momentum at present.
Chart Patterns
The chart shows a range-bound movement with periodic tests of the aforementioned resistance and support levels. Recent price movements suggest a potential downward trend toward the next support level if the current price continues to decrease.
Conclusion
Given the current technical analysis of BNB/USDT, the market seems to be in a cautious phase with a potential bearish bias due to the MACD's positioning. However, the RSI provides a slightly conflicting signal, suggesting some remaining bullish sentiment. Investors and traders should monitor these indicators closely along with any geopolitical or economic news that could influence market sentiment. The key will be to watch for potential rebounds off support levels or a breakthrough above current resistance, which would necessitate a reassessment of the bearish outlook. As always, maintaining a balanced perspective with stop-loss orders to manage risks is advisable in such volatile environments.

A powerful crypto exchange that just started. UPDATEEverything is pumping and rising soon, US500, EURUSD, GOLD, BITCOIN ETC
It is a coin of a major crypto exchange and definitely a good choice. The crypto industry is in its infancy
Only up!