BNB tapped the imbalance — and I stepped in.There was no panic here. Just rebalancing.
BNB just dipped into the 0.5 level at 653.28 — right at the base of a 1H FVG and overlapping with a minor demand wick. Most won’t even notice what just happened. But Smart Money sees the shift.
The market provided liquidity for entries without breaking structure.
The 1H OB above — from 657.5 to 661.4 — is now the magnet. It’s unmitigated, and clean.
If price holds this mid-volume shelf and we reclaim above 655.2, I expect rapid delivery into the OB, potentially overshooting for premium distribution into higher inefficiencies.
Execution logic:
Entry zone: 652.9–653.3
Reclaim trigger: above 655.2
TP1: 657.5
TP2: 661.4
SL: below 651.3 (0.618) or tighter under 648.6 (0.786 if aggressive)
You don’t need a breakout.
You need balance — and the discipline to strike when it returns.
BNBUSDT trade ideas

Buy### Important and main block order ### can cause a return and reaction to the level. ### In the low time frame, wait for the first ceiling to break and trade when hitting the block!!!! ###buy ###choch

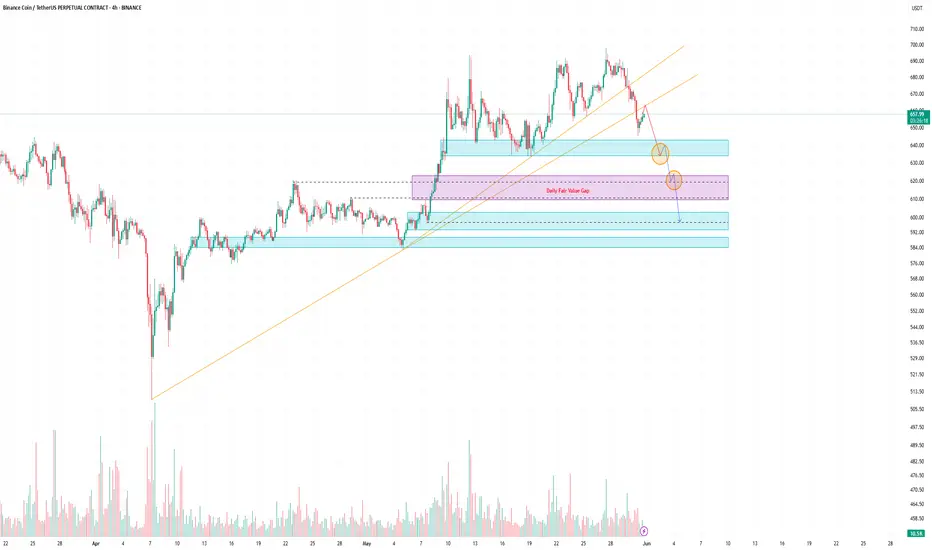
BNB Breakdown or Fakeout? Key Levels AheadBNBUSDT – Possible Retest and Key Support Areas
Price has decisively broken the ascending trendline. A retest of that trendline is now likely, followed by a potential move down toward the first support zone (light blue box) between $630 and $640.
📌 Main scenario:
A strong bounce from this area could mark the beginning of a trend reversal (personally, I don’t think it will drop much further).
However, if bearish pressure continues, the key levels to watch are:
$610/$620 – the two dashed black lines inside the Fair Value Gap.
$600 – second support.
$580/$590 – final and most important support, a critical area for the trend structure.
📍 Price action to be watched closely in the coming hours.

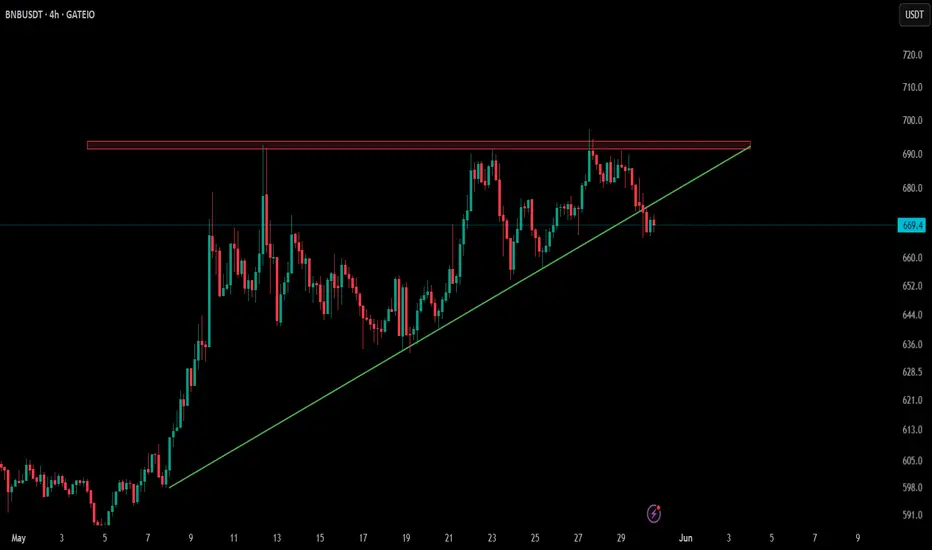
BNB – Ascending Triangle Breakdown (4H)🟡 CRYPTOCAP:BNB has broken below its ascending triangle structure on the 4H chart.
📉 Momentum points to a potential test of lower supports, but a reversal could be in the cards too.
🔍 Keep a close watch — next moves could set the tone for this pair!
HolderStat┆BNBUSDCRYPTOCAP:BNB breakout watch: Binance Coin reclaims the 692 pivot, carving a triangle within an ascending channel and aiming at the 740 supply zone. Technical analysis notes firm trend-line support, bolstering a bullish continuation view for traders.

BNB/USDT"Binance, like Ethereum, is in its best condition right now. Do you think it will go up or down?"

BNB/USDT Trade Setup: Bullish Trend, Discount Entry & Fibonacci 📈 BNB/USDT Trade Setup Breakdown 💰🔥
Currently watching BNB / USDT closely... and it's looking interesting! 🧐
BNB has been in a steady, bullish trend with consistent retracements into equilibrium of previous price ranges — offering repeated opportunities to buy at a discount. 📉💸
My bias remains bullish — I'm looking to continue with the trend.
Price has pulled back into my optimal entry zone, you could get long now or wait for a deeper pullback, depending on your personal entry criteria. 🎯
🛡️ Stop-loss goes just below the previous swing low, maintaining tight risk control.
In this video, I break down:
🔹 How I use Fibonacci + Fibonacci extension for precise entries and target zones
🔹 My custom Risk/Reward tool, a variation of the Fib extension.
🔹 Key zones I’m watching, and how I’m managing this setup.
⚠️ Not financial advice. Always do your own research and manage risk accordingly.
💬 Your opinions or feedback? Let me know in the comments 👇

The key is whether it can rise above 691.77
Hello, traders.
If you "Follow", you can always get the latest information quickly.
Have a nice day today.
-------------------------------------
(BNBUSDT 1D chart)
The key is whether it can rise above the previous ATH point of 691.77 and maintain the price.
Currently, I think the OBV indicator is showing an increase with trading volume as it rises above the High Line.
-
If it fails to rise, we should check whether the price can be maintained above the M-Signal indicator on the 1D chart.
If it falls below the HA-High indicator point of 654.90, it will eventually fall below the M-Signal indicator on the 1D chart, so it is likely to turn into a short-term decline, so caution is required when trading.
If it continues to fall further, it is expected to determine the trend again when it meets the M-Signal indicator on the 1W chart.
-
If it rises above 691.77 and maintains the price, it seems likely to renew the ATH.
-
The basic trading strategy is to buy near the HA-Low indicator and sell near the HA-High indicator.
However, if it is supported and rises on the HA-High indicator, it is likely to show a stepwise rise, and if it is resisted and falls on the HA-Low indicator, it is likely to show a stepwise fall.
Therefore, the basic trading method should be a split trading method.
You should establish a basic trading strategy that suits your investment style.
Otherwise, you may trade in the wrong direction due to subjective thoughts caused by price volatility.
-
Thank you for reading to the end.
I hope you have a successful trade.
--------------------------------------------------
- This is an explanation of the big picture.
(3-year bull market, 1-year bear market pattern)
I will explain more details when the bear market starts.
------------------------------------------------------

HolderStat┆BNBUSD breakthrough bastion to 750CRYPTOCAP:BNB — Downtrend line shattered; retest formed a tight rectangle just above 635 neckline. Strong consolidation over rising support signals intent to reach the 720-760 extension zone marked atop former range. Bulls must guard 600-610 to preserve breakout psychology.

BNB will rest after reaching 1000BNB has successfully bounced back from the support area and heading towards the next resistance which is around 900-1000. This target is easily achievable for BNB since is fundamentally strong and BNB ecosystem is heavily used.
I'm expecting BNB to reach 1000 in 3rd of this year.
Follow Our TradingView Account for More Technical Analysis Updates, | Like, Share and Comment Your thoughts.
Cheers
GreenCrypto

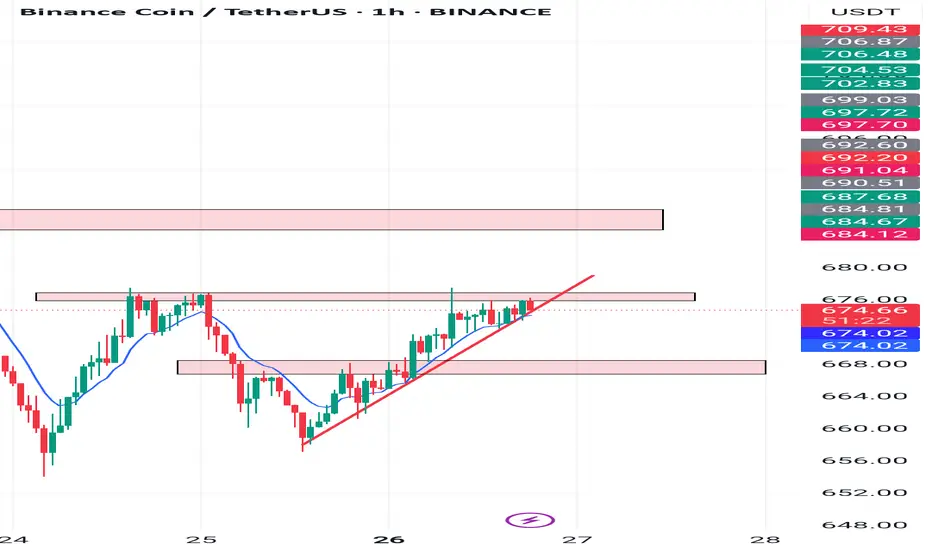
BNB/USDT (1H Timeframe)Current Price:
$674.94 (up +0.82%)
Key Observations:
1. Rising Wedge Formation:
Price is moving upward inside a rising wedge, which is generally a bearish pattern.
The price is currently testing the upper resistance zone near $675–$676.
2. Resistance Zone:
Strong resistance zone is marked just above the current price.
This area has previously acted as supply and could trigger a pullback.
3. Support Zones:
First key support is around $668–$670 (lower pink box).
Major support below that is around $660–$663.
4. Moving Average:
Price is trading above the blue moving average, indicating short-term bullish momentum.
Possible Trading Scenarios:
Bearish Setup (More likely due to wedge pattern):
If price gets rejected at the current resistance and breaks below the wedge:
Short Entry: Below $673
Target 1: $668
Target 2: $660
Stop Loss: Above $676
Bullish Breakout Scenario:
If price breaks and closes strongly above $676:
Long Entry: Above $677
Target 1: $684
Target 2: $692
Stop Loss: Below $673
Binance Coin (BNB): Seeing Signs of Weakness | Ideal Short ZoneBinance Coin is still hovering near our ideal zone of rejection.
We are waiting for more confirmations, but the longer we see struggle near this zone and failed attempts at upward moves, the more confident we are getting in a possible move that is coming here soon.
If all plays out well and we see a proper MSB form on a smaller timeframe, we will be looking for the movement to lower zones and entry for the trade as well.
Swallow Academy

$BNB liquidity sweepScalping on M15, quite a number liquidity at 620-650 region, a potential long scalp seem to be opened after the downward correction. A sweet short.
1.5RR to 2RR is possible. this is what the STIC indicator is showing. using the institutional liquidity zone line plot.
NFA and DYOR by the way.

Binance Coin (BNB): Reaching Our "Ideal Short Zone"Binance Coin is testing once again the major resistance trend, which has been a good rejection point for the coin since January 2025.
For 4 months this zone has been respected and we are expecting the pattern to repeat and price to move for another liquidity hunt (and maybe from there we might see a proper movement to lower zones). Our first target would be $512, which is in the region where previous liquidity candles have been stopped.
Swallow Academy

Binance Coin (BNB): We Might Be Falling Hard | Key Resistance Binance coin is trading in inbetween the key resistance zone and a liquidity barrier where we are seeing the pressure from sellers and overall a bigger movement to lower zones. to happen soon.
More in-depth info is in the video—enjoy!
Swallow Academy

HolderStat┆BNBUSD prepare to test $700CRYPTOCAP:BNB surges out of a falling-channel base, then prints twin consolidation pennants that keep hugging an accelerating support rail near 640 USDT. Friday’s fresh thrust through the pennant roof drags price back inside the long-term rising wedge, opening a measured path toward the 720-740 resistance shelf. As long as the inner trendline at 630-635 holds, momentum traders can lean on the channel mid-line; a daily close below 600 would defer—but not defeat—the bullish thesis.

BNB/USDT , 1HrPattern is looking Good , If BTC is Sustaining Above 1,06,834 this level then , This BNB pattern will Give a Good Breakout ,
Enter only When Upper Trendline is Breakout
Take Your Own Risk According to your Capital .
Follow for More Ideas Like This

BNB Ready for a Major Breakout? Head & Shoulders Pattern in PlayMarket Insight:
#BNB is currently trading in a prime buying zone for spot traders, showing strong price action on the 4-hour timeframe. A Head and Shoulders (H&S) pattern is forming, and we are closely monitoring its breakout for a potential bullish move.
🔹 Bearish Signs? None so far! The market structure remains intact, and buyers seem to be in control.
Trade Plan for Bulls:
🔹 Breakout Confirmation: A clean break above the neckline of the H&S pattern will confirm bullish momentum.
🔹 Entry Zone: After confirmation, a long position can be initiated with proper risk management.
🔹 Stop Loss & Risk Management: Place a stop-loss below the right shoulder to manage risk effectively.
🔹 Potential Target: If the breakout holds, we could see a strong upward move toward key resistance levels.
🔹 Chart Analysis: (Attach a well-annotated chart with clear trendlines, breakout zones, and risk-reward levels)
🔹 What’s Your Take?
Do you think #BNB will break out or face rejection? Drop your thoughts in the comments!
Like & Follow for more real-time trade setups!

BNBUSDT | Watching the Blue BoxesBNBUSDT is setting up a possible move, and I’ll be watching for an upward break inside the blue boxes .
No need to jump the gun. If price breaks out with volume and confirms on a lower timeframe, that’s where opportunity begins .
“I will not insist on my short idea. If the levels suddenly break upwards and do not give a downward break in the low time frame, I will not evaluate it. If they break upwards with volume and give a retest, I will look long.”
Let others guess. You wait with purpose.
📌I keep my charts clean and simple because I believe clarity leads to better decisions.
📌My approach is built on years of experience and a solid track record. I don’t claim to know it all but I’m confident in my ability to spot high-probability setups.
📌If you would like to learn how to use the heatmap, cumulative volume delta and volume footprint techniques that I use below to determine very accurate demand regions, you can send me a private message. I help anyone who wants it completely free of charge.
🔑I have a long list of my proven technique below:
🎯 ZENUSDT.P: Patience & Profitability | %230 Reaction from the Sniper Entry
🐶 DOGEUSDT.P: Next Move
🎨 RENDERUSDT.P: Opportunity of the Month
💎 ETHUSDT.P: Where to Retrace
🟢 BNBUSDT.P: Potential Surge
📊 BTC Dominance: Reaction Zone
🌊 WAVESUSDT.P: Demand Zone Potential
🟣 UNIUSDT.P: Long-Term Trade
🔵 XRPUSDT.P: Entry Zones
🔗 LINKUSDT.P: Follow The River
📈 BTCUSDT.P: Two Key Demand Zones
🟩 POLUSDT: Bullish Momentum
🌟 PENDLEUSDT.P: Where Opportunity Meets Precision
🔥 BTCUSDT.P: Liquidation of Highly Leveraged Longs
🌊 SOLUSDT.P: SOL's Dip - Your Opportunity
🐸 1000PEPEUSDT.P: Prime Bounce Zone Unlocked
🚀 ETHUSDT.P: Set to Explode - Don't Miss This Game Changer
🤖 IQUSDT: Smart Plan
⚡️ PONDUSDT: A Trade Not Taken Is Better Than a Losing One
💼 STMXUSDT: 2 Buying Areas
🐢 TURBOUSDT: Buy Zones and Buyer Presence
🌍 ICPUSDT.P: Massive Upside Potential | Check the Trade Update For Seeing Results
🟠 IDEXUSDT: Spot Buy Area | %26 Profit if You Trade with MSB
📌 USUALUSDT: Buyers Are Active + %70 Profit in Total
🌟 FORTHUSDT: Sniper Entry +%26 Reaction
🐳 QKCUSDT: Sniper Entry +%57 Reaction
📊 BTC.D: Retest of Key Area Highly Likely
📊 XNOUSDT %80 Reaction with a Simple Blue Box!
📊 BELUSDT Amazing %120 Reaction!
📊 Simple Red Box, Extraordinary Results
I stopped adding to the list because it's kinda tiring to add 5-10 charts in every move but you can check my profile and see that it goes on..

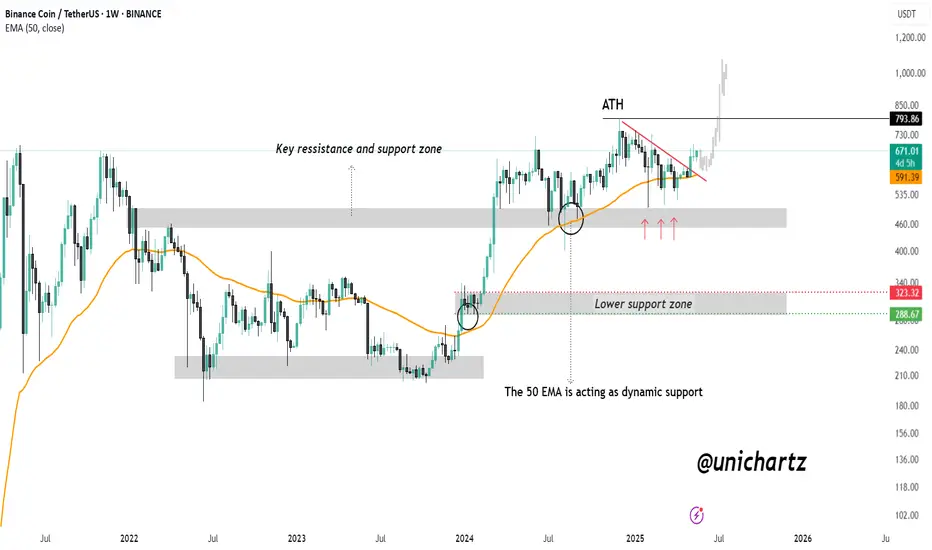
BNB Weekly Breakout: Road to $1,000?CRYPTOCAP:BNB is showing strong bullish momentum on the weekly chart. The 50 EMA is acting as a dynamic support, holding firm during multiple retests and providing a solid foundation for upward movement.
Recently, price action has broken above a key descending resistance line and successfully reclaimed a major support-resistance zone, turning it into a strong base. This area, which previously acted as a battleground for bulls and bears, is now supporting the current rally.
As long as BNB continues to hold above this zone and the 50 EMA, the structure remains bullish. With sustained momentum, a retest of the all-time high zone around $793 is likely, and a breakout above it could open the door for a move toward $1,000 and beyond.
DYOR, NFA
HolderStat┆BNBUSD digesting the wedge breakCRYPTOCAP:BNB shattered a year-long descending wedge, sprinted to 670 USDT, and now forms a pennant atop the 620 neckline. Holding 620 keeps the 700-730 target alive; drop below 600 and price risks sliding back inside the old wedge toward 560. 🔔

BNB is doing(4H) <|-)According to my past analyses BNB was moving through a channel down and needing to break one border to discover a new route.OK?..Allright,now we're watching it has done and broken it up.Moving up now is possible
