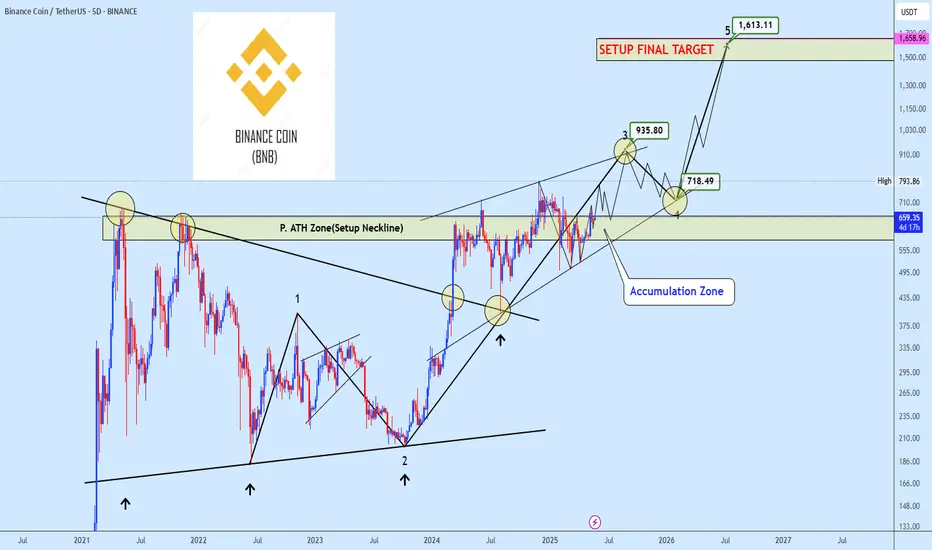
BNBUSDT preparing for major upside RallyBNBUSDT has broken out of a major bullish structure and has since transitioned into a well defined ascending wedge, suggesting the development of an extended Wave 3 within an impulsive Elliott sequence.
Price is currently progressing toward the projected Wave 3 target around $935, a level that also coincides with a significant historical supply zone. Once reached, this area may trigger a sharp corrective pullback, likely forming Wave 4.
Should this correction hold above key structural support, the final impulsive leg toward the $1,613 region is expected to complete the ongoing trading cycle for BNB.
We invite you to share your perspective in the comments and revisit our earlier BNB analysis linked below for broader context on this setup.
BNBUSDT trade ideas
Descending channel continues(BNB,4H)According to last analysis the price moves through a descending channel.It has to break one border to find a new route.

HolderStat┆BNBUSD consolidation breakout hunts 700-720CRYPTOCAP:BNB ended a protracted falling-channel decline by igniting from a tight consolidation rectangle around 600 USDT. The ensuing surge stalled near 670 and is now rechecking the breakout zone at 640, which also aligns with the underside of a freshly drawn rising wedge. A successful hold here could catapult price toward the 700-720 resistance corridor, the depth equivalent of the prior consolidation range. Slip back under 620 would risk sliding into the old channel.

BNBUSDT(4H);descending channelIt's in a descending range.Therefore,it will either follow the channel or break one of the levels to deliver the price to PRICE ACTION :-<


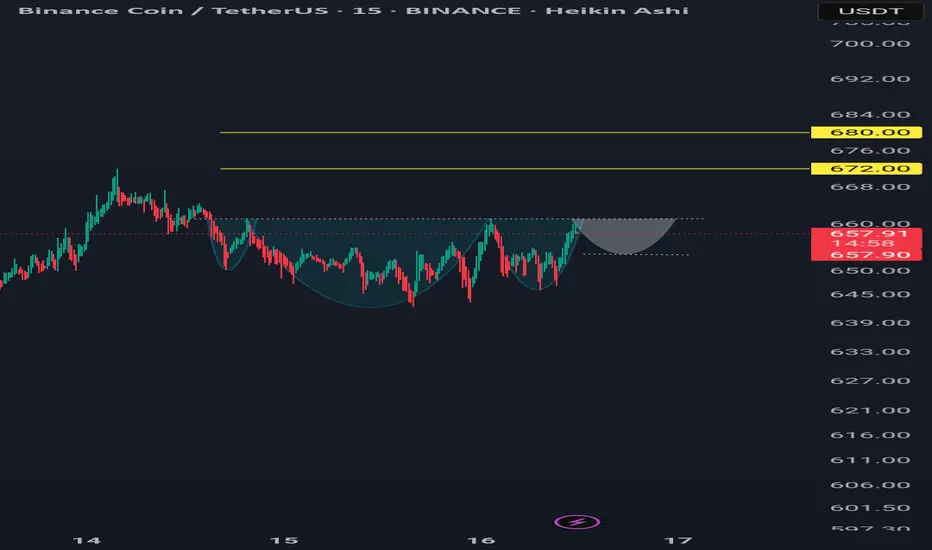
Bnbusdt micro strategy 15min tfA bullish head and shoulders pattern is forming on the 15-minute timeframe. For a better risk-reward ratio (RRR), I recommend waiting for another swing below the resistance.
However, a close above 661.17 may activate the pattern even without a smaller swing.
Consider entering at the close above resistance or on the pullback.
A good entry point is between 661.17 and the bottom of the right shoulder; the lower your buy price, the better the RRR. A close below the bottom of the right shoulder would invalidate the pattern.
The targets are 672 and 680.
BNB in Logarithmic Chart — A Massive Breakout Incoming?"Logarithmic view of BNB shows a multi-year ascending triangle forming right under a strong historical resistance. Price is coiling tighter and volume remains relatively stable. Is BNB preparing for a breakout after years of consolidation?"
#BNB #BinanceCoin #Crypto #BullRun
👇👇👇👇👇👇

The Secret Behind Bitcoin’s Sudden Nighttime PumpsHow does Bitcoin suddenly make wild jumps at night?
Whales are playing behind the scenes while amateur traders keep falling into traps!
In this analysis, you’ll learn how to spot these mysterious pumps and actually profit from them.
Hello✌
Spend 3 minutes ⏰ reading this educational material. The main points are summarized in 3 clear lines at the end
🎯 Analytical Insight on BNB: A Personal Perspective:
BNB has broken out of its multi-day descending channel to the upside 📈, yet the move lacks strong momentum and decisive follow-through. Historically, Binance Coin tends to trend with measured, deliberate price action rather than sharp rallies. A potential retest of the channel breakout zone remains possible, with a medium-term target set at $710 — representing a projected 9% move, assuming price holds above key support 🛡️.
Now , let's dive into the educational section ,
1. Nighttime Pumps: Whale Games or Just Luck? 🐋🎲
Sudden Bitcoin pumps during low-volume hours, especially at night, usually come from big whale moves or a cluster of smaller whales acting together. When market volume is low, even a small order can move the price drastically.
These engineered moves often aim to trick retail traders and create fake hype.
2. What Do On-Chain Data Say? 📊🔍
By checking on-chain data like transaction volumes, active addresses, and coin movements in big wallets, we can tell if a pump is real and sustainable or just a temporary shock.
For example, a rise in exchange inflows alongside a pump could signal a potential mass sell-off after a rapid price jump.
3. Market Psychology at Night 🧠🌙
Night hours usually see reduced trading volume, which increases volatility and risk. Less experienced traders often get emotional and jump in quickly due to FOMO (Fear Of Missing Out).
Learn how to control your emotions and wait patiently for confirmed signals like a pro.
4. Key Indicators & Advanced TradingView Tools to Spot Night Pumps 📈🛠️
To catch Bitcoin’s sudden night pumps, rely on key indicators like RSI, MACD, volume, and Bollinger Bands. For instance, a sudden volume spike with RSI in the overbought zone can warn you a pump is ending.
Additionally, TradingView’s innovative tools like Volume Profile and Order Flow let you see whale buying/selling pressure and identify critical support/resistance levels.
These tools reveal the real market structure during volatile night moves, helping you make sharper, lower-risk decisions.
Don’t forget multi-timeframe analysis to avoid false signals and understand pumps within bigger trends.
5. Strategies for Trading Night Pumps ⚔️⏳
One of the best ways is setting tight stop-loss orders and scalping during these moves.
Using price action analysis and following whale behavior from analyst insights can guide you to smarter entries and exits.
6. Risks and Important Tips ⚠️💡
Always remember, sudden pumps carry high risk and can lead to liquidation.
Trading during low-volume hours isn’t recommended for beginners. Stay aware of market volatility and emotional impulses.
7. Summary 📝✅
Nighttime Bitcoin pumps can be great profit opportunities but only if you enter with knowledge and a plan.
By understanding on-chain data, market psychology, and key indicators, you’ll make smarter decisions and benefit from these mysterious moves.
However , this analysis should be seen as a personal viewpoint, not as financial advice ⚠️. The crypto market carries high risks 📉, so always conduct your own research before making investment decisions. That being said, please take note of the disclaimer section at the bottom of each post for further details 📜✅.
Give me some energy !!
✨We invest countless hours researching opportunities and crafting valuable ideas. Your support means the world to us! If you have any questions, feel free to drop them in the comment box.
Cheers, Mad Whale. 🐋

BNB Daily Chart – Trendline Break or Rejection?🚨 BNB – Trendline Test in Progress
📊 On the daily timeframe, BNB is pushing up against key trendline resistance 🔼
A successful breakout here could ignite fresh bullish momentum, while a rejection might lead to another retest lower.
👀 Crucial moment playing out—watch the reaction closely!
BNBUSDT - Potential SupportWhen my latest BNB analysis() still printing, best trade is the one you make with your profits!
I'm watching BNB, specifically this blue box, where buyers might step in.
If price drops to this zone, I won't trade blindly. I'll look for a breakout above a small resistance level within the box, followed by a retest as support on a lower timeframe. This confirms buyer interest.
I'll also monitor order flow, CDV divergences, and volume spikes for clues. In narrow ranges, watch for liquidity hunts dips below support that quickly recover. Failed breakouts above resistance within the box, or regained levels, are also key.
Remember, I won't insist on a short if price breaks upward with volume and retests that level as support; I'll consider longs. Flexibility and confirmation are crucial.
I hope we reach this blue area to gauge the market reaction. Expect volatility. Missing this setup could be costly. Stay tuned for updates; you can rely on my insights.
📌I keep my charts clean and simple because I believe clarity leads to better decisions.
📌My approach is built on years of experience and a solid track record. I don’t claim to know it all but I’m confident in my ability to spot high-probability setups.
📌If you would like to learn how to use the heatmap, cumulative volume delta and volume footprint techniques that I use below to determine very accurate demand regions, you can send me a private message. I help anyone who wants it completely free of charge.
🔑I have a long list of my proven technique below:
🎯 ZENUSDT.P: Patience & Profitability | %230 Reaction from the Sniper Entry
🐶 DOGEUSDT.P: Next Move
🎨 RENDERUSDT.P: Opportunity of the Month
💎 ETHUSDT.P: Where to Retrace
🟢 BNBUSDT.P: Potential Surge
📊 BTC Dominance: Reaction Zone
🌊 WAVESUSDT.P: Demand Zone Potential
🟣 UNIUSDT.P: Long-Term Trade
🔵 XRPUSDT.P: Entry Zones
🔗 LINKUSDT.P: Follow The River
📈 BTCUSDT.P: Two Key Demand Zones
🟩 POLUSDT: Bullish Momentum
🌟 PENDLEUSDT.P: Where Opportunity Meets Precision
🔥 BTCUSDT.P: Liquidation of Highly Leveraged Longs
🌊 SOLUSDT.P: SOL's Dip - Your Opportunity
🐸 1000PEPEUSDT.P: Prime Bounce Zone Unlocked
🚀 ETHUSDT.P: Set to Explode - Don't Miss This Game Changer
🤖 IQUSDT: Smart Plan
⚡️ PONDUSDT: A Trade Not Taken Is Better Than a Losing One
💼 STMXUSDT: 2 Buying Areas
🐢 TURBOUSDT: Buy Zones and Buyer Presence
🌍 ICPUSDT.P: Massive Upside Potential | Check the Trade Update For Seeing Results
🟠 IDEXUSDT: Spot Buy Area | %26 Profit if You Trade with MSB
📌 USUALUSDT: Buyers Are Active + %70 Profit in Total
🌟 FORTHUSDT: Sniper Entry +%26 Reaction
🐳 QKCUSDT: Sniper Entry +%57 Reaction
📊 BTC.D: Retest of Key Area Highly Likely
📊 XNOUSDT %80 Reaction with a Simple Blue Box!
📊 BELUSDT Amazing %120 Reaction!
📊 Simple Red Box, Extraordinary Results
I stopped adding to the list because it's kinda tiring to add 5-10 charts in every move but you can check my profile and see that it goes on..

BNB/USDT – Support & Resistance- WEEK-4Pair: BNB/USDT
Market Condition: Sideways / Consolidation
BNB/USDT is currently trading within a well-defined horizontal range, indicating indecision among bulls and bears. Price is oscillating between Resistance (R1) and Support (S1) with no clear trend at the moment.
Resistance Zone (R1): Capping bullish moves
Support Zone (S1): Preventing breakdowns
Breakout Strategy (Bullish Bias):
If price breaks above Resistance 2 (R2):
Entry (Buy Stop): Above R2
Stop Loss: Below R1
TP1: As Mentioned
TP2: Extended bullish target (1:2)
Hashtags:
#BNBUSDT #BNB #CryptoAnalysis #SidewaysMarket #RangeTrading #BreakoutSetup #CryptoTrading #TechnicalAnalysis #CryptoSignals #PriceAction #SmartTrading #RiskManagement #BinanceCoin

HolderStat┆BNBUSD 645 gate opens 730BNB price surged out of a steep falling channel and later coiled inside a tight consolidation rectangle, igniting a vertical drive that now hovers under the 645 USDT horizontal cap. Holding the breakout origin at 600‑610 keeps the upside narrative intact; clearance of 645 exposes the 720‑730 objective derived from the earlier channel depth.

BNBUSDT Analysis: Potential Trap at a Regular Support LevelThere is a very regular support level on BNBUSDT, which appears too consistent to be trusted. This kind of setup often acts as a trap for buyers , enticing entries before breaking down.
I plan to go long if the support is broken and price reaches my blue box zone for an optimal entry. This zone represents a strong area of interest where I anticipate a reversal back upward.
Key Points:
Regular support: Likely a trap, avoid premature entries.
Blue box: My buy zone for a potential long position after the support break.
Strategy: Wait for confirmation and enter cautiously within the blue box.
If you think this analysis helps you, please don't forget to boost and comment on this. These motivate me to share more insights with you!
I keep my charts clean and simple because I believe clarity leads to better decisions.
My approach is built on years of experience and a solid track record. I don’t claim to know it all, but I’m confident in my ability to spot high-probability setups.
My Previous Analysis
🐶 DOGEUSDT.P: Next Move
🎨 RENDERUSDT.P: Opportunity of the Month
💎 ETHUSDT.P: Where to Retrace
🟢 BNBUSDT.P: Potential Surge
📊 BTC Dominance: Reaction Zone
🌊 WAVESUSDT.P: Demand Zone Potential
🟣 UNIUSDT.P: Long-Term Trade
🔵 XRPUSDT.P: Entry Zones
🔗 LINKUSDT.P: Follow The River
📈 BTCUSDT.P: Two Key Demand Zones
🟩 POLUSDT: Bullish Momentum
🌟 PENDLEUSDT.P: Where Opportunity Meets Precision
🔥 BTCUSDT.P: Liquidation of Highly Leveraged Longs
🌊 SOLUSDT.P: SOL's Dip - Your Opportunity
🐸 1000PEPEUSDT.P: Prime Bounce Zone Unlocked
🚀 ETHUSDT.P: Set to Explode - Don't Miss This Game Changer
🤖 IQUSDT: Smart Plan
⚡️ PONDUSDT: A Trade Not Taken Is Better Than a Losing One
💼 STMXUSDT: 2 Buying Areas
🐢 TURBOUSDT: Buy Zones and Buyer Presence
🌍 ICPUSDT.P: Massive Upside Potential | Check the Trade Update For Seeing Results
🟠 IDEXUSDT: Spot Buy Area | %26 Profit if You Trade with MSB
📌 USUALUSDT: Buyers Are Active + %70 Profit in Total

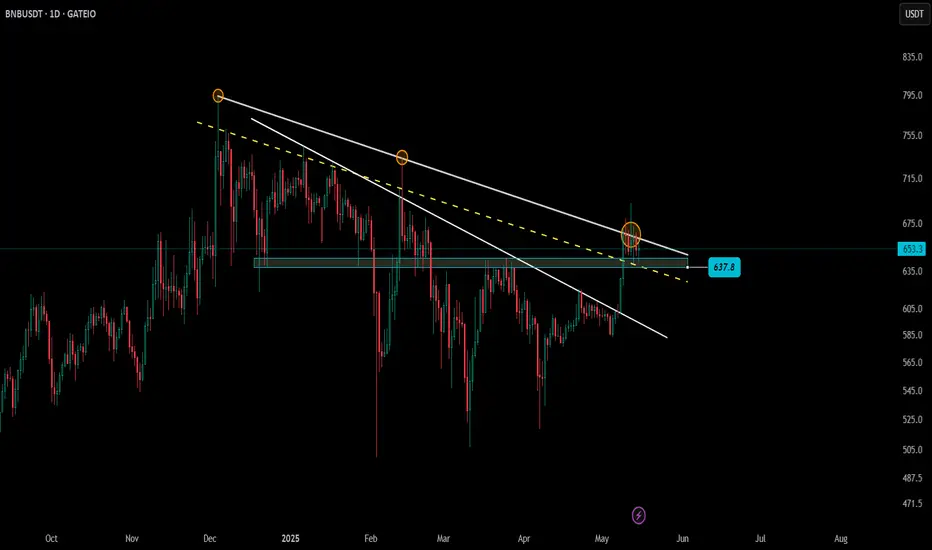
Lingrid | BNBUSDT Bullish Pause Before Potentail RallyThe price perfectly fulfilled my previous idea . BINANCE:BNBUSDT recently broke out of a prolonged downward channel and surged into the resistance zone, briefly tapping the 700 level before retracing. The price action now consolidates above the swap zone, suggesting a potential retest before continuation. This A-B-C corrective move could provide a launchpad for bulls.
📌 Key Levels
Support zone: 637
Invalidation level: Below 637
Target area: 700
⚠️ Risks
A failure to hold the swap zone may lead to a drop toward the 600–580 range
Bearish divergence or sharp rejection from 700 may limit upside continuation
Traders, if you liked this idea or if you have your own opinion about it, write in the comments. I will be glad 👩💻

Binance Coin Will Trade At $1,200+, $975 First—New ATH TargetSupport has been confirmed and Binance Coin is now moving in the bullish zone. This is perfect. Now that the bulls have control of the Cryptocurrency market, we no longer have to focus on oscillators, volume, candlestick patterns and the rest, we can simply focus on the targets; things change.
This same approach will be true for all the charts. Instead of reading the signals and sharing "proofs" supporting my bias, we will focus instead on the targets and how far up the pair in question can go. Why? Because the bullish bias has already been confirmed and we are set to grow long-term. The 2025 bull market just as promised.
The first resistance is $730. This is a strong resistance because it rejected growth several times in the past. Many times in December, several times in January and February also. The All-Time High is pretty close as well so here again we will define a range. Between $731 and $794 is the first resistance zone.
BNBUSDT can grapple with this zone for a small while only to win. The win will clear the path for higher prices and open the price discovery phase. After this resistance is broken, the rise will be smooth and nice. Just growth followed by more growth, it will feel great.
The first target will be $975. This is the 1.618 extension in relation to the size of the corrective move. This is a level to watch out for on the way up.
The next target is awesome because the number is so big and because it goes beyond $1,000. The number is $1,269, that's the second—very strong—target.
Depending on how these levels are handled, we can look again and update the chart.
I don't know if this needs to be said, but, just to be certain: Binance Coin is going up .
Namaste.

BNBUSDT | Long Bias | Accumulation Breakout | (May 12, 2025)BNBUSDT | Long Bias | Accumulation Breakout + Strong Spot Demand | (May 12, 2025)
1️⃣ Short Insight Summary:
BNB has been building strength after a long accumulation around the $581 zone. Price has now broken above the value area high and is showing strong support from spot buyers. With rising open interest and volume, the setup favors continuation to the upside.
2️⃣ Trade Parameters:
Bias: Long
Entry: Around $633 (current breakout zone)
Stop Loss: Below $633 with plan to reduce risk and potentially re-enter near $582
TP1: $740
TP2: $780
TP3: $960
Final TP: $1,100 (if market momentum extends)
Partial Exits: Recommended at each level to secure gains and reduce risk as price climbs
3️⃣ Key Notes:
✅ Strong spot buying activity supports the bullish case, confirming that this is not just a derivative-led move.
✅ Open interest is rising, showing confident participation from both retail and institutions.
✅ Price is holding above the value area high, a key bullish signal following accumulation.
✅ Risk is well-managed with the plan to reduce exposure and recompound near $582 if needed.
❌ Be mindful of profit-taking zones like $740 and $780 where price might slow temporarily.
4️⃣ Optional Follow-up Note:
BNB is looking technically and sentimentally aligned for upside. I’ll be tracking closely and updating if structure shifts or macro conditions impact continuation.
Please LIKE 👍, FOLLOW ✅, SHARE 🙌 and COMMENT ✍ if you enjoy this idea! Also share your ideas and charts in the comments section below! This is best way to keep it relevant, support us, keep the content here free and allow the idea to reach as many people as possible.
Disclaimer: This is not financial advice. Always conduct your own research. This content may include enhancements made using AI.

BNB/USDT Potential UpsidesHey Traders, in today's trading session we are monitoring BNBUSDT for a buying opportunity around 630 zone, BNBUSDT is trading in an uptrend and currently is in a correction phase in which it is approaching the trend at 630 support and resistance area.
Trade safe, Joe.

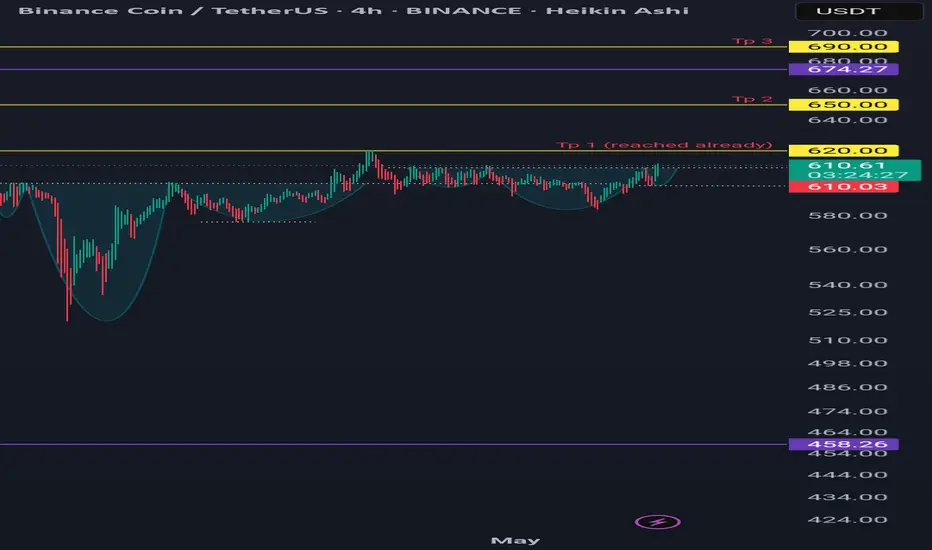
BNB/USDT 4H Chart: Rising Channel with Fractal Vibes!Hey traders! Binance Coin is showing some promising action that’s got me on the edge of my seat!
We’ve got a clear rising channel in play, with BNBUSDT moving beautifully in sync with a fractal line pattern shown above the chart — mirroring past price behavior like a roadmap! BNBUSDT is currently trading at $650 , I think price will continue bouncing between the channel’s support at $620-$600 and move upwards to the key resistance target at $700-$720 . A breakout above this resistance could send BNB soaring to new highs, potentially targeting $800 or beyond!
However, if BNB fails to break through, we might see a pullback to the channel support at $620-$600 .
Key Levels to Watch:
Resistance: $700-$720
Support: $620-$600
Breakout Target: $800+
Breakdown Risk: $600
Is BNB about to blast through $720, or will it retreat below support? Let’s hear your thoughts below!

BNB | HTF ANALYSIS
BREAKDOWN :
- Bullish Price Action across the block,
- GG fundementals + Massive Utlity,
- Backed by CZ, in for the longer run,
- PA broke the previous high causing a Cisd (change in state of delievery) while getting acceptance over the monthly Volume Gap region,
- Not neccesairly but if you wanna add more onto your buying power 574.6ish is a good region to scale in.
TARGETS
Aiming 1012-1157-1392ish regions as LONG TERM SPOT HOLD

Very critical position for BNB long-term levelFrom a structural perspective, BINANCE:BNBUSDT BNB's daily and weekly charts, along with long-term indicators, appear to be at a critical inflection point.
If it can successfully break through this level—especially with support from macro fundamental developments—a new trend may emerge.
However, technical analysis can only serve as a reference and should not be relied upon as a predictor of long-term value realization.

BNB/USDT 1D chartHello everyone, let's look at the 1D BNB chart to USDT, in this situation we can see how the price came out of the downward trend line and currently persists over it.
Going further, let's check the places of potential target for the price:
T1 = $ 686
T2 = $ 732
Т3 = $ 795
Let's go to Stop-Loss now in case of further declines on the market:
SL1 = $ 648
SL2 = $ 599
SL3 = 541 $
Looking at the RSI indicator, we see a clear increase on the indicator that crossed the upper limit, which can also affect the potential relaxation.

BnbusdA big head and shoulder pattern activated a month ago with 3 tp targets formed a new small head and shoulder pattern above the buy zone.
BNB chart updateI see a terminated wave in BNB which have a Red scenario. also we can count this termination a middle B of ABC growing pattern in green one scenario.
