DeGRAM | BNBUSD Came out of the Downward Wedge📊 Technical Analysis
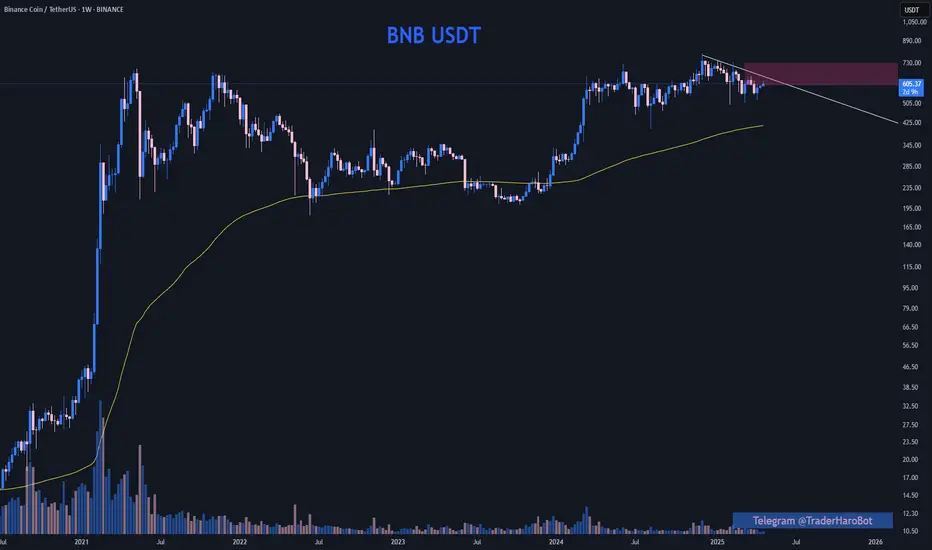
● Price has broken the 7-month descending wedge and closed above the purple resistance near $600, flipping it to support.
● Successful retest plus a series of higher lows inside a nascent up-channel point toward $655 (trend-line cap) and the wider supply at $730.
💡 Fundamental Analysis
● The Lorentz main-net hard fork (29 Apr) cuts BNB Chain block times and boosts throughput, spurring on-chain activity.
● Kraken’s new BNB listing and growing alt-coin ETF odds keep demand firm; FXStreet notes a $590 breakout opens a path to $650+.
✨ Summary
Breakout + network upgrade reinforce a short-term long bias: objectives $655 → $730.
-------------------
Share your opinion in the comments and support the idea with a like. Thanks for your support!
BNBUSDT trade ideas

BNB is in an interesting zoneBNB is going to test its ATH at previous cycle (around $700) and at the next step, its total ATH (around $800). If it break these levels, BNB parabola is inevitable. At this situation, BSC tokens like NASDAQ:FORM , $Cookie, NASDAQ:CAKE and ... will have potential to explode.

$bnb clear bullishlook for retest to long.
if spot start buying DCA
or long high lev on breakout
life time play with target atleast 900$ easily. 1000$ is momentum not stop. Goodluck all

BNB waiting for breakoutBuy after successfully penetrating this resistant line with a short -term target of at least 10%+ from here.

$BNB Surprised $678 Price Mega Big pumping & Touch to $700+ ✨ CRYPTOCAP:BNB Surprised $678 Price Mega Big pumping & Trying to $700+ Milestone again.
💫 From Breaking News:
• BNB Eyes $700 as CZ Pushes 90% Binance Chain Fee Cut
•Bhutan Partners with Binance Pay and DK Bank to Launch the World’s First National Crypto-Based Tourism Payment System
BNB price surged over 10%, hitting $642.92 after CZ’s 90% BSC gas fee cut proposal.
RSI reached 78.42, confirming strong bullish momentum and overbought conditions.
BNB may test $700 if Binance validators approve the proposed BEP-336 transaction model.
On May 9, Binance Coin (BNB) climbed to $642.92, rising over 10% in 24 hours. The price rally followed a proposal from Binance founder Changpeng Zhao (CZ) to cut gas fees on Binance Smart Chain (BSC) by 90%.
#Write2Earn #bnb #BinanceSquareFamily #MarketRebound #SUBROOFFICIAL
Disclaimer: This article is for informational purposes only and does not constitute financial advice. Always conduct your own research before making any investment decisions. Digital asset prices are subject to high market risk and price volatility. The value of your investment may go down or up, and you may not get back the amount invested.

BNB is definitely on its way to $1000.BNB has been consolidating for around 250 days , which is a solid amount of time to build momentum for a breakout. It's almost certain that BNB will hit $1000 soon .
However, this prediction becomes invalid if the price breaks down below $500 with significant volume.
A good price range for accumulation is between $500–$650.
CRYPTO:BNBUSD

Binance Coin (BNB)The world's largest crypto exchange by volume, Binance continues its push into the embattled crypto mining industry with a plan to begin offering a crypto cloud mining product next month. crypto miners have had a tough year, with the price of bitcoin having hung around $20,000 for months, a far cry from its peak above $68,000 in November 2021. Other cryptos have faced similar or even worse declines. One of the largest mining-related firms in the U.S. filed for Chapter 11 bankruptcy in late September. Other companies, however, are seeing opportunity from this crisis, with CleanSpark going on a buying spree of mining rigs and data centers, and DeFi platform Maple Finance starting a $300 million lending pool
Binance Pool announced its own $500 million lending fund for bitcoin miners last week and said it would enter cloud mining, a service that allows investors – who otherwise might not be able to buy and operate their own equipment – to rent crypto mining machines. The official launch of the cloud mining service will come in November.
BNB can back to 300 in a short time but 195 is a good price for entry and long term investment

BNB Technical Setup NEXT TARGET
Binance Coin is currently testing the upper boundary of a descending channel on the daily timeframe — a critical technical spot. A clean breakout above this resistance could open the door for a strong rally.
🎯 Targets on Breakout:
First Target: $640
Second Target: $670
Final Target: $740
🧠 Key Insight:
Reclaiming this trendline resistance could flip market sentiment bullish. Momentum traders should watch for confirmation.

BNB Ready for PUMP or what ?Currently, BINANCE:BNBUSDC is forming an ascending triangle, indicating a potential price increase. It is anticipated that the price could rise, aligning with the projected price movement (AB=CD).
However, it is crucial to wait for the triangle to break before taking any action.
Give me some energy !!
Stay Awesome , CobraVanguard

BNB Big ChannelBNB create big up trend channel in high timeframe
Breaking 620 we can posible go to 700 or higher

BNB wants lower- clear downtrend in place
- low volatility suggests a big move is around the corner
- monthy resistance acting as, well, resistance
- first target is around 500$, could eventually go as low as 400

BNB BUY LIMIT Hello friends
Due to the entry of buyers and the registration of higher ceilings and floors, we can buy in the direction of the trend and with capital and risk management within the specified ranges and move to the specified targets.
*Trade safely with us*

Trade Setup Alert : BNB Levels to Watch 👀 Welcome to my Trading View Analysis and Trading Channel Here , we share the latest market analysis, trading signals, and key insights together .
Ready for smarter trades ? ⭐️
📊 BNB Technical Analysis – Key Zone in Focus for the Next Move
The BNB coin recently broke above the critical $584 resistance level and has successfully consolidated above it. This marks the second time the price has touched this zone, and in response, a strong bullish candle has formed — indicating a clear respect for this important area.
📍 Key Levels & Potential Trade Setups
Currently, the $584–$618 range acts as a decision zone, and price action here will likely determine the next major move.
🟢 If the price breaks above $618:
✅ A long position trigger is confirmed
🎯 Bullish targets:
First target: $732
Second target: $793
🔴 If the price drops below $584:
✅ A short position trigger is activated
🎯 Bearish target: $531
🧠 Additional Insights:
The 3 SMA indicator is currently positioned above the consolidation zone, potentially acting as dynamic resistance.
This area holds strategic importance for the Binance Smart Chain (BSC) ecosystem, making price behavior here highly significant.
⚠️ Final Notes:
We are at a crucial inflection point in the market. So:
Watch candlestick behavior closely
Maintain proper risk management
Wait for clear breakout confirmation before entering any trade
I love you all so much . 👀
don't forget about capital management and risk management .
Be careful with your positions . 🥇

BNB Is Entering Into Final Stage Of Bull RunHello, Skyrexians!
BINANCE:BNBUSDT is the rare asset which showed the bull market with the Bitcoin and set the new ATH. Like Bitcoin BNB is also about to show us the final growth wave.
On the 2 weeks time frame we can see how this bull market has been developing. Awesome Oscillator gives us a hint that wave 3 is likely to be finished because we see the bearish divergence without zero line cross. Only when it crossed under zero line we can say that wave 4 is finished. Another one factor is fibonacci target area which has been reached. The next wave 5 will be started in 1-2 month and reach approximately $900.
Best regards,
Ivan Skyrexio
___________________________________________________________
Please, boost this article and subscribe our page if you like analysis!

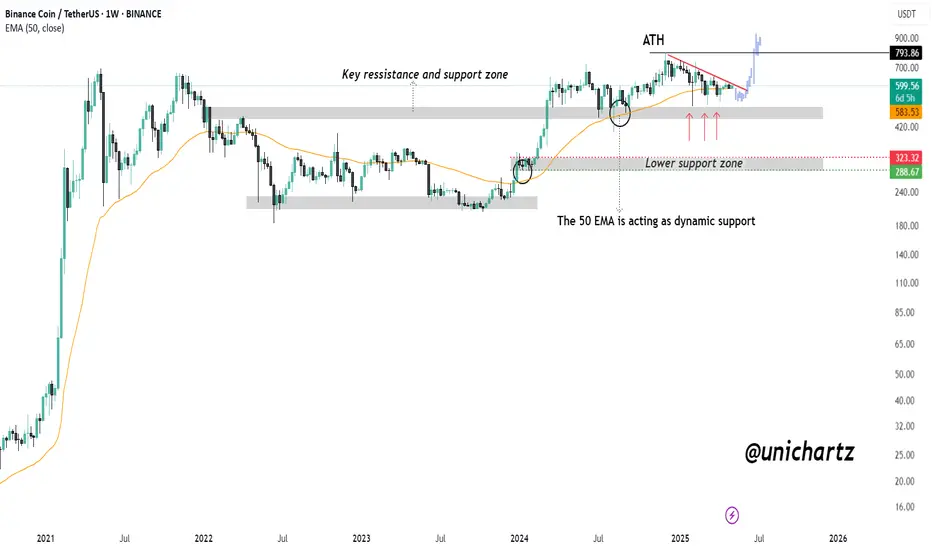
BNB Bull Flag Activated — Watching for $794 CRYPTOCAP:BNB is showing strong bullish momentum after rebounding off the marked support zone. This level, which previously acted as resistance, is now holding firmly as support following the breakout.
As long as BNB sustains above this zone, the bullish structure remains intact — and the path toward a new All-Time High (ATH) around $794 is wide open. The 50 EMA continues to act as dynamic support, further strengthening the setup.
DYOR, NFA
HolderStat | Smart money is interested in BNB🚀 Wallet Snapshot:
● Recent moves: withdrew 26.62 BNB from Binance → Bitget & UniversalRouter; swapped 122.78 K KILO via PancakeSwap
● Top holdings: 17.962 CRYPTOCAP:ETH | 13.683 CRYPTOCAP:BNB | 122.781 K BYBIT:KILOUSDT
● Performance: $250 K+ net profit
Savvy rotation perfectly timed for this mark-up phase! 🔥

Macro Distribution on BNB is about to play outBNB is showing clear signs of distribution on the Macro to those who know what to look for.
Big players are selling at the tops and loading off on retail. If we lose the $500 level we could head much lower.

BNB/USDT 1D chart Hello everyone, let's look at the 1D BNB chart to USDT, in this situation we can see how the price moves in a triangle where there is still space to keep the currently ongoing side trend. Going further, let's check the places of potential target for the price:
T1 = $ 599
T2 = $ 617
Т3 = $ 644
Let's go to Stop-Loss now in case of further declines on the market:
SL1 = $ 580
SL2 = $ 559
SL3 = $ 542
SL4 = 521 $
Looking at the MacD indicator, you can see an attempt to return to the upward trend, but here we do not have clear confirmation, which is why it is worth being careful.

BNB Ready for PUMP or what ?Currently, BNB is forming an ascending triangle, indicating a potential price increase. It is anticipated that the price could rise, aligning with the projected price movement (AB=CD).
However, it is crucial to wait for the triangle to break before taking any action.
Give me some energy !!
✨We spend hours finding potential opportunities and writing useful ideas, we would be happy if you support us.
Best regards CobraVanguard.💚
_ _ _ _ __ _ _ _ _ _ _ _ _ _ _ _ _ _ _ _ _ _ _ _ _ _ _ _ _ _ _ _
✅Thank you, and for more ideas, hit ❤️Like❤️ and 🌟Follow🌟!
⚠️Things can change...
The markets are always changing and even with all these signals, the market changes tend to be strong and fast!!

BNB's situation+ Target PredictionThe BNB is in a Bullish phase by a Falling Wedge Pattern.
A falling wedge indicates the potential for price to reach to $760.
Note if the Wedge Pattern is broken downwards with the strength of Bearish candles , this analysis of ours will be failed.
Give me some energy !!
✨We spend hours finding potential opportunities and writing useful ideas, we would be happy if you support us.
Best regards CobraVanguard.💚
_ _ _ _ __ _ _ _ _ _ _ _ _ _ _ _ _ _ _ _ _ _ _ _ _ _ _ _ _ _ _ _
✅Thank you, and for more ideas, hit ❤️Like❤️ and 🌟Follow🌟!
⚠️Things can change...
The markets are always changing and even with all these signals, the market changes tend to be strong and fast!!

BNB Daily – Symmetrical Triangle Above Key Support ZoneBNB/USDT is currently trading at $600, forming a symmetrical triangle pattern above the critical support zone between $519 and $475. This structure is a sign of compression, where price consolidates with higher lows and lower highs, often leading to a breakout. The triangle is forming directly on top of a major historical support area, adding strength to the bullish scenario.
Price is currently above the Ichimoku cloud, with Span A at $602.05 and Span B at $582.44, reflecting a shift toward bullish conditions. The cloud is beginning to twist upward, and the price is attempting to reclaim momentum after several weeks of sideways action.
The Trend Strength Index (TSI) confirms this momentum shift:
TSI(20): 0.72, indicating medium-term bullish strength is building.
TSI(10): -0.25, showing short-term neutrality, consistent with current consolidation.
Scenarios to Watch:
Entry Within the Triangle (Current Price Area):
The first potential long setup comes from the current trading range, as BNB remains well-supported within the triangle and above the key zone at $519. The formation of higher lows suggests buyers are stepping in with more strength at each test. As long as price holds above $582 and stays within the structure, this is a valid area for early positioning with a tight invalidation point below the recent swing low.
Breakout and Retest of $644:
A more conservative entry would be to wait for a clear breakout above $644, followed by a successful retest of that level as new support. This would confirm bullish continuation out of the triangle, potentially accelerating momentum toward the main target.
Trade Setup Summary:
Entry 1: Current range inside the triangle, near $600
Entry 2: Break and retest of $644
Target: $792
Stop Loss: Below $519
BNB remains one of the most resilient large-cap tokens due to its strong utility within the Binance ecosystem. It's used to pay trading fees, access launchpads, and participate in DeFi tools built around the Binance Smart Chain (BSC). Despite regulatory pressure on Binance globally, the platform maintains dominant market share and consistent user activity. On-chain, BNB continues to benefit from token burns and low-fee applications. As broader market sentiment stabilizes, structurally sound tokens like BNB are likely to lead recovery phases, especially with strong technical setups like the one currently forming.
Disclaimer: This content is for educational and informational purposes only. It does not represent financial advice or a recommendation to buy or sell any financial instrument. Trading involves risk, and you should only trade with money you can afford to lose.

Long trade
BNBUSDT Buyside Trade
Date/Time: Sunday, 27th April 2025, 2:45 AM (New York Time)
Pair: BNBUSDT
Session: Tokyo to London Transition
Entry TF: 15-Minute
🔹 Entry: 598.55
🔹 Take Profit: 606.20 (+1.28%)
🔹 Stop Loss: 597.03 (–0.25%)
🔹 Risk-Reward Ratio: 5.03
Trade Reasoning
Bullish consolidation just above a reclaimed support zone after a minor liquidity sweep.

BNB looking strongCRYPTOCAP:BNB held strong during the past 3 months' dump!
Now heading into resistance. Clean, solid chart.