Binance Coin / TetherUS forum
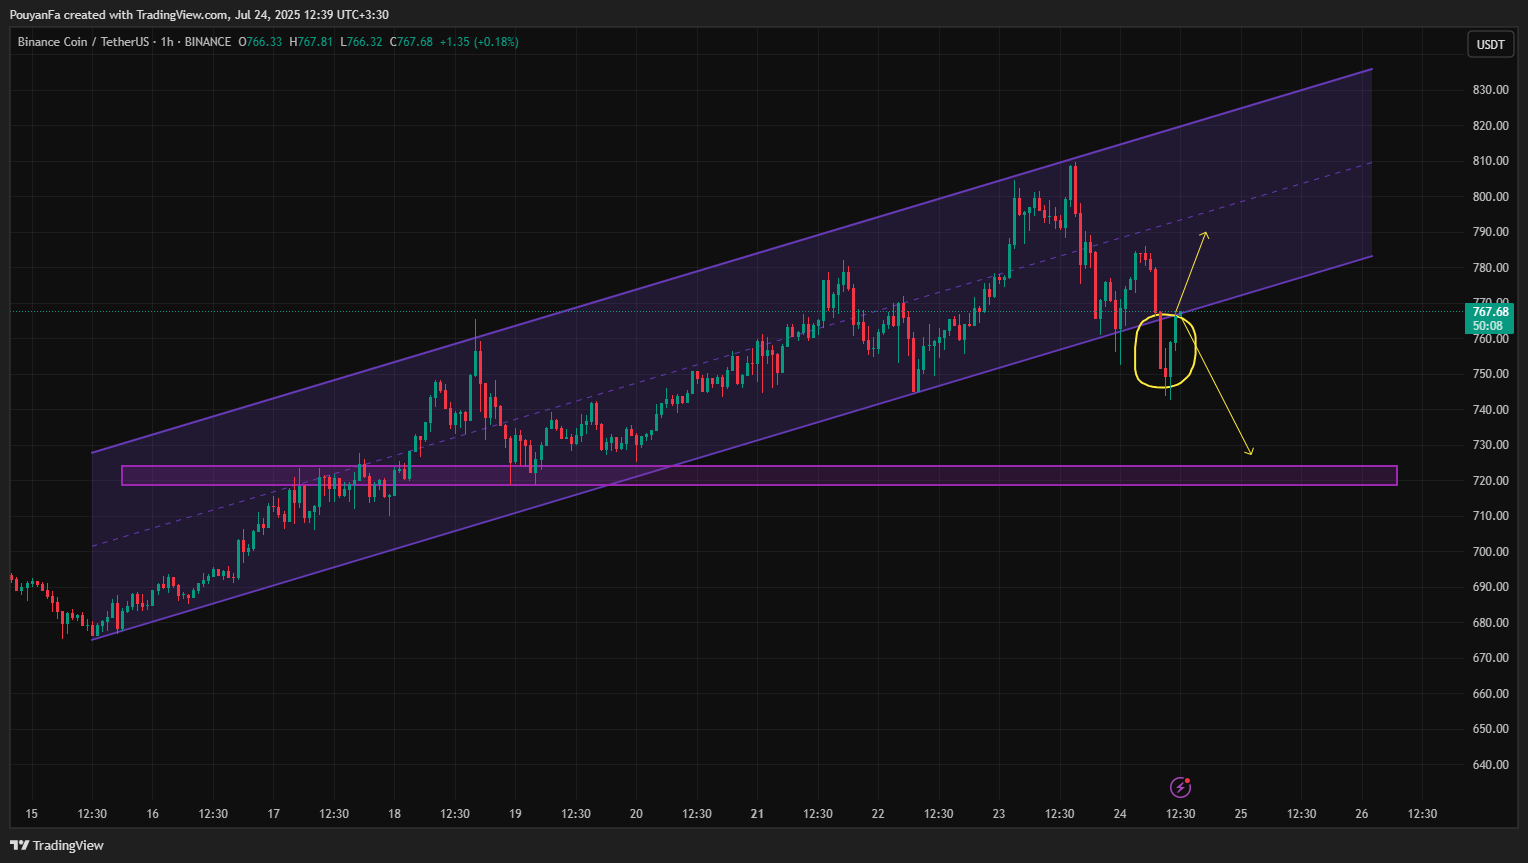
🎯 Entry: 766
❌ Stop Loss: 758.5
✅ Take Profit 1: 774.0
✅ Take Profit 2: 780.0

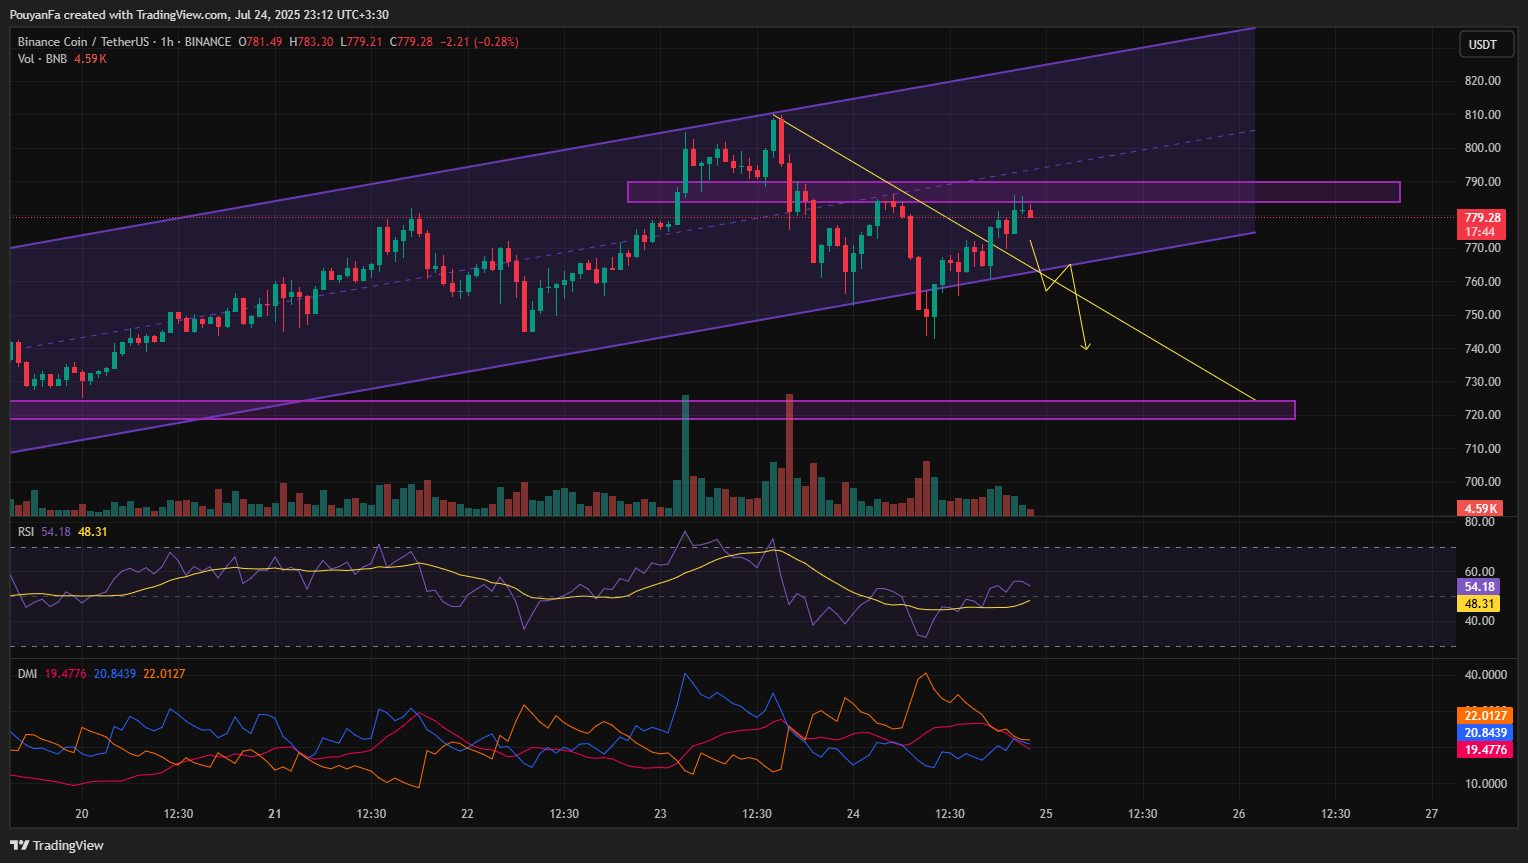
Although BNB has approached the correction level of its last impulsive move, it hasn’t yet completed this correction. Another pullback might occur. We’re already talking about a BNB that’s making new ATHs one after another.
If you ask my opinion, I’m not sure if I would buy a project that has already hit an ATH, especially when there are many others that haven’t reached their ATHs yet or are still below them. But to be clear—BNB hasn’t finished its correction. For that to happen, it needs to pull back to the $812 level. If that correction completes, the target will be $896.
There are a lot of imbalance gaps in BNB. Since I won’t be opening any position, I don’t recommend opening one either.
Users who subscribed their BNB to Simple Earn (Flexible and/or Locked) and/or On-Chain Yields products from 2025-07-10 00:00 UTC to 2025-07-13 23:59 UTC will get the airdrops distribution.
Binance will then list TREE at 2025-07-29 14:00 UTC and open trading against USDT, USDC, BNB, FDUSD, and TRY pairs.
Max Token Supply: 1,000,000,000 TREE
HODLer Airdrops Token Rewards: 12,500,000 TREE (1.25% of total token supply)
Circulating Supply upon Listing on Binance: 156,122,449 TREE (15.61% of total token supply)

🌟 Attention, Money Makers & Market Robbers! 🌟
(Hola! Oi! Bonjour! Hallo! Marhaba!)
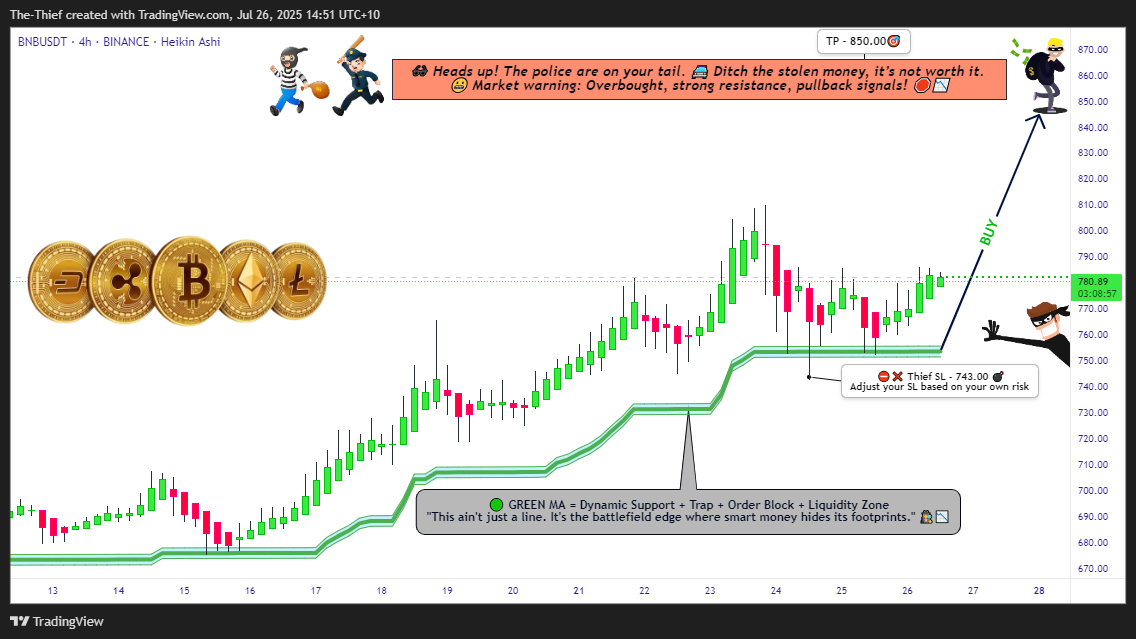
The BNB/USDT vault is CRACKED OPEN—time to execute the ultimate heist! 🏦💰 Based on 🔥Thief Trading Style Analysis🔥, here’s your lucrative robbery blueprint for the Binance Coin vs. Tether market.
🔐 MASTER PLAN: LONG ENTRY HEIST (HIGH-RISK, HIGH-REWARD)
🎯 TARGET: 850.00 (or escape before the cops show up!)
🚨 POLICE TRAP ZONE: Overbought + Strong Resistance – Bears & cops are lurking!
💎 TAKE PROFIT EARLY & TREAT YOURSELF! (You’ve earned it, outlaw!)
⚔️ ENTRY STRATEGY: SWIPE FAST OR WAIT FOR THE PULLBACK!
🤑 VAULT IS OPEN! Enter any price if you’re bold (instant long).
🕵️♂️ SMART THIEVES: Use buy limit orders near 15M/30M swing lows/highs for a safer heist.
🛑 STOP-LOSS (ESCAPE ROUTE)
Thief SL: 743.00 (4H candle wick – adjust based on your risk tolerance!)
⚠️ WARNING: If the cops (bears) break in, DON’T HESITATE—RUN!
🎯 TARGETS & ESCAPE PATHS
Scalpers: Trail your SL & escape with quick loot! (Only long-side allowed!)
Swing Bandits: Hold strong but watch for police traps!
The sell signal is about to be triggered.