💸💸BNT - Will change your life 💸💸excellent chart, with a potential of 120,000%, if you still believe in the altseason, then this is an excellent investment for the long term. We saw that this low cap coin can grow by 200% per day) So we just have to wait.
Good luck everyone. DYOR

✳️ Bancor | Test & RetestAfter the bullish breakout, Bancor (BNTBTC) moves down to test a previous resistance level as support. Now that this level holds as support, blue line on the chart, we can expect the bullish wave that started early August to resume, aka, new highs.
We can easily expect higher prices on this pair.

✳️ Bancor ATL Can Lead To 555% Bullish WaveBancor on the 26-June session hit a new All-Time Low, the session closed as a dragonfly doji, a reversal signal.
We have a double bullish divergence, MACD and RSI, on the weekly timeframe. The divergence starts June 2022. This is a very strong bullish signal.
These signals put together can indicat

BNT/BTC - Bancor: Resistance_Breakout◳◱ A Resistance Breakout has been identified on the $BNT / CRYPTOCAP:BTC chart. The price has broken above a key resistance level, indicating a potential bullish trend. The next resistance key levels are located at 0.00001319 | 0.00001361 | 0.00001427, and the major support zones can be found at 0

#BNTBTC - Long - Potential 49.70%Style: SWING TARGETS
Direction: LONG
Market: SPOT
Risk: 0.25% - 1%
Leverage: N/A
EXCHANGE: BINANCE
#BTC_BNT
TIMEFRAME: 720
ENTRY: 0.00002024
⎿ TP5: 0.00004048
⎿ TP4: 0.00003036
⎿ TP3: 0.000024288
⎿ TP2: 0.000022264
⎿ TP1: 0.000021252
STOP: 0.00001752
Decisive trend break following a fai

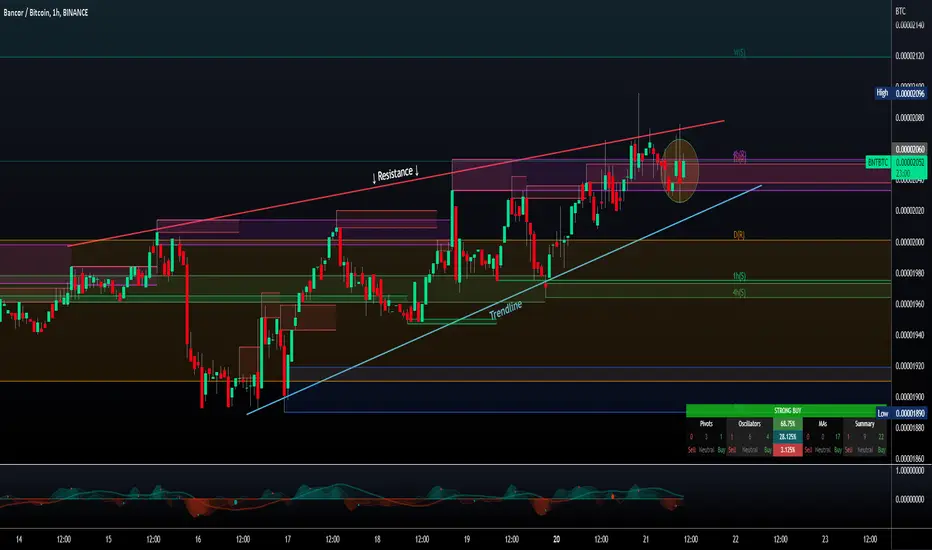
$BNT/#BTC [#Bancor]: Resistance_Breakout_Confirmation◳◱ We've detected a Resistance Breakout and Confirmation on the $BNT / $BTC chart. The price has broken above a key resistance level and has been confirmed by a strong candle, indicating a potential bullish trend. The next resistance key levels are at 0.0000207 | 0.00002143 | 0.00002306 and the majo
BNT/BTC is having a divergenceWill BNT pop up? The OBV indicator is going higher while price is going sideways.
Bancor protocol is buying its own supply back. They quit minting new coins and are burning BNT.
They are developing a new AMM where the trading fees will always be paid in BNT.
The tokenomics are starting to look be

Beautiful technical pattern on the HTF BNT-BTC pairLet's see if this breaks up massively in Jan/Feb 2022 or maybe even sooner!

BNTBTC Technical Analysis
BNTBTC on H4 has tried several times to break above the significant resistance but it couldn’t. After the last Pullback it seems that it is going to break above it soon.
⬆️Buy now or Buy at 0.00008475
⭕️SL @ 0.00007795
✅TP1 @ 0.00009040
✅TP2 @ 0.00009200
✅TP3 @ 0.00009300
✅TP4 @0.00009600
✅TP5

BNTBTC - Long - Potential 37.62%BNTBTC - Long - Potential 37.62%
Exchanges: Binance
Signal Type: Regular (Long)
Entry Zone:
0.00008941 - 0.00009931
Take-Profit Targets:
1) 0.00010796
2) 0.00012311
3) 0.00013632
Stop Targets:
1) 0.00007976
Entry Trigger- Multiple sequential Oversold indicators across multiple timeframes telling

See all ideas
Summarizing what the indicators are suggesting.
Oscillators
Neutral
SellBuy
Strong sellStrong buy
Strong sellSellNeutralBuyStrong buy
Oscillators
Neutral
SellBuy
Strong sellStrong buy
Strong sellSellNeutralBuyStrong buy
Summary
Neutral
SellBuy
Strong sellStrong buy
Strong sellSellNeutralBuyStrong buy
Summary
Neutral
SellBuy
Strong sellStrong buy
Strong sellSellNeutralBuyStrong buy
Summary
Neutral
SellBuy
Strong sellStrong buy
Strong sellSellNeutralBuyStrong buy
Moving Averages
Neutral
SellBuy
Strong sellStrong buy
Strong sellSellNeutralBuyStrong buy
Moving Averages
Neutral
SellBuy
Strong sellStrong buy
Strong sellSellNeutralBuyStrong buy
Displays a symbol's price movements over previous years to identify recurring trends.