BNT for a 15%RSI have a good configuration on many timeframe. On the neutral zone daily. Soon on the neutral zone on the 4h. Which is a good configuration for a dip. Maybe wait for a better configuration on the hourly and 15min for a better precision. Tp on different resistance and fibo level. It may go higher than the previous top because the RSI have a good daily configuration and is probable in a dip. But it would be a longer trade.
BNTBTC trade ideas

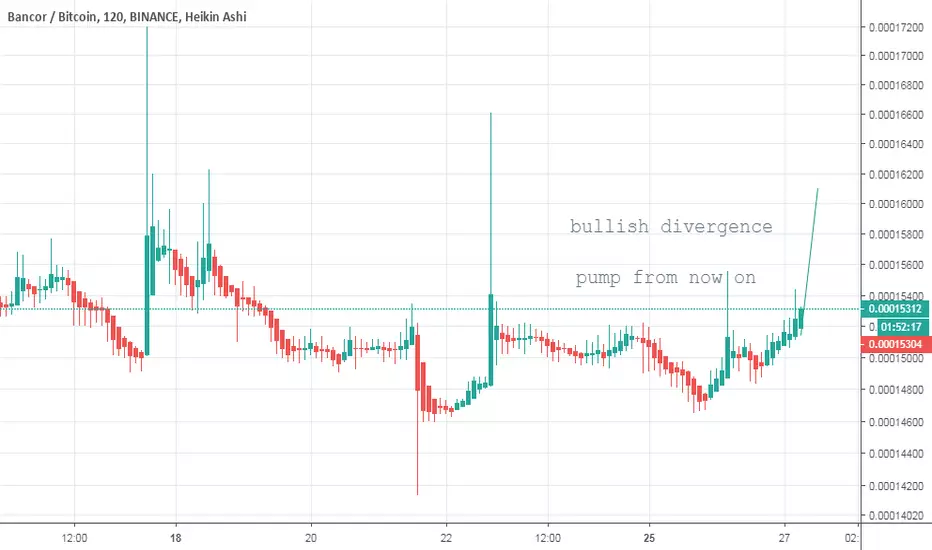
#BNTBTC #BNT TIME FOR BREAKOUTBNT breakout time very soon. Check the link
Please push the like button and follow me please


Continuidad de tendenciaPodemos ver un rebote mas despues del ultimo impulso que tuvimos por lo cual si vemos los Niveles de Fibonacci con Expansión si pasa el nivel
del 23% llegaremos con un buen profit ademas debemos tomar en cuenta nuestro Stop Loos el cual esta por debajo de la ultima zona de volune donde fue la última subida grande.

#BNT/BTC WILL PUMP 100% #BINANCE, PRICE ANALYSIS AND PREDICTION#BNT/BTC is now looking very bullish in every Td 2hr-1day. Ema in every TF below the last 2 candles and going up straight. And bollinger band is opening also in every TF, MACD is also showing curve and ready to go up in next 6-8 hours.Rsi is very strong from now on.
#Get ready for some gains.
My Targets are 15850-16400-17000.
#THANKS.
FOR MORE DAILY CRYPTO PREMIUM SIGNALS CONTACT US AT:
s.m.jawwad.rizvi@gmail.com
BNT/BTC - D1 timeframe updateNice buy volume in D1, this is a positive signal to buy some BNT
Buy zone: below 0.00015520
Target 1: 0.00018913
Target 2: 0.00023376
Target 3: 0.00030021
Stoploss: 0.00014014
** If you like our content follow our profile (www.tradingview.com) to get more daily ideas. **
Comments and likes are greatly appreciated.

A trading opportunity to buy in BNTBTCTechnical analysis:
. Bancor/Bitcoin is in a range bound and the beginning of uptrend is expected.
.The price is above the 21-Day WEMA which acts as a dynamic support.
. The RSI is at 53.
Trading suggestion:
. There is a possibility of temporary retracement to suggested support zone (0.00015100 to 0.00013800). if so, traders can set orders based on Price Action and expect to reach short-term targets.
Beginning of entry zone (0.00015100)
Ending of entry zone (0.00013800)
Entry signal:
Signal to enter the market occurs when the price comes to "Buy zone" then forms one of the reversal patterns, whether "Bullish Engulfing" , "Hammer" or "Valley" in other words,
NO entry signal when the price comes to the zone BUT after any of the reversal patterns is formed in the zone.
To learn more about "Entry signal" and the special version of our "Price Action" strategy FOLLOW our lessons:
Take Profits:
TP1= @ 0.00018700
TP2= @ 0.00019500
TP3= @ 0.00021900
TP4= @ 0.00023500
TP5= @ 0.00027000
TP6= @ 0.00030050
TP7= @ 0.00035350
TP8= @ 0.00048170
TP9= @ 0.00057770
TP10= @ 0.00071100
TP11 = @ 0.00100500
TP12 = Free

Daily Bullish Signal $BNT #BNT #BNTBTC (26 March 2019)RED ARROW indicates the EXPECTED Time and Targets
Level Stoploss point up to maximize profit and reduce risk
I'm working all the time, even in Bearish Market


BNTBTC entered in potential reversal zoneThe price action is dropped between 0.618 to 0.786 fibonacci retracement area to form some harmonic pattern.
We have 100MA in buying zone and 50MA just beneath the buying zone as firm supports even I am expecting a golden cross of 50 and 100MA insha Allah.
The targets are:
Buy between: 0.00015962 to 0.00014620
Sell between: 0.00017016 to 0.00020184
!!!
Plz don't forget to activate below essential resources for better crypto trading:
For instant buy and sell bitcoins through bank account,cards, cash and different mediums the best and authentic sites are:
Localbitcoins:
localbitcoins.com
Remitano:
remitano.com
Coinspot (for australians)
www.coinspot.com.au
Link for best trading platform Binance:
www.binance.com
Regards,
Atif Akbar (moon333)

A trading opportunity to buy in BNTBTCTechnical analysis:
. Bancor/Bitcoin is in a range bound and the beginning of uptrend is expected.
.The price is above the 21-Day WEMA which acts as a dynamic support.
. The RSI is at 51.
Trading suggestion:
. There is a possibility of temporary retracement to suggested support zone (0.00015100 to 0.00013800). if so, traders can set orders based on Price Action and expect to reach short-term targets.
Beginning of entry zone (0.00015100)
Ending of entry zone (0.00013800)
Entry signal:
Signal to enter the market occurs when the price comes to "Buy zone" then forms one of the reversal patterns, whether "Bullish Engulfing" , "Hammer" or "Valley" in other words,
NO entry signal when the price comes to the zone BUT after any of the reversal patterns is formed in the zone.
To learn more about "Entry signal" and the special version of our "Price Action" strategy FOLLOW our lessons:
Take Profits:
TP1= @ 0.00018700
TP2= @ 0.00019500
TP3= @ 0.00019500
TP4= @ 0.00023500
TP5= @ 0.00027000
TP6= @ 0.00030050
TP7= @ 0.00035350
TP8= @ 0.00048170
TP9= @ 0.00057770
TP10= @ 0.00071100
TP11 = @ 0.00100500
TP12 = Free

BNT IF my math is correct we will have a reversal around the red line, time will tell if I am correct

Hit The Bank With BancorBruce Lee Trader Form: Market is Free so Be The Market... good luck and enjoy..


Wolfe Formation BNT/BTC2-4 Resistance line is already broken.
TP1 -----> 1-4 line
Stop ------> under 2-4
Good Luck

Falling wedge...... Small falling wedge inside a big FW breaking in $BNT bouncing from support at ~13275sats, MACD about to bull cross. RSI Rising. UCTS showing a buy on the 6h. Volume is MIA yet... Potential target the upper trendline of the bigger FW. Falling below current support cancels it. #BNT


Bancor Crazy Candles Strong Move Upcoming [400-500% Possible]The Bancor (BNTBTC) chart has produced two "crazy" candles, signals of a strong move in the making, but where will this move go, up or down?
Let's start with the daily chart:
On the chart above you can see a red candle (yellow-negative) and a green one to the right (positive).
Notice that the volume on the GREEN candle, is way higher than the RED (yellow) candle.
You can also notice the MACD bullish crossover and the bullish RSI.
Now, for a final confirmation we look at the weekly chart (which is the main chart above).
Trading week closes within 32 hours. The candlestick that you are seeing is really bullish in nature and signals a trend reversal.
The volume is off the books, higher than bull run volume. So you can expect a very strong positive move coming from Bancor (BNTBTC).
Can't say you weren't warned... I hope you enjoy the profits.
With patience it is possible.
Namaste.
