BONDUSDT Ascending Triangle !BONDUSDT Technical Analysis update
Buy zone : Below $4.71
Stop loss : $4.41
Take Profit 1 : $4.95
Take Profit 2 : $5.55
Take Profit 3 : $6.70
Always Keep StopLoss
BONDUSDT trade ideas

BOND/USDT Break the Bullish Flag or Fail and Back to demand ??💎 BOND has certainly caught our eye as it navigates through the Bullish Flag pattern. Presently, BOND is at a critical juncture, confronting the resistance trendline within this Bullish Flag formation. A decisive breakout from this pattern is necessary for BOND to sustain its upward trajectory.
💎 Failure to penetrate this resistance trendline could lead to a setback, prompting BOND to seek reinforcement at the demand zone between $3.578 and $3.32, thereby gathering strength for another upward push. Conversely, a successful breach of the pattern, probability could pave a smooth path for BOND to reach our anticipated targets in the supply zone and the bearish OB region.
💎 However, a less favorable scenario might unfold if BOND, while retesting the demand area, struggles to uphold support, jeopardizing its stability. This inability to maintain its foothold could validate a downward momentum, reverting BOND to a bearish stance. Under these circumstances, BOND might retreat towards the Bullish OB for support or potentially descend further, intensifying the bearish pressure.

Bond is bullishAccording to the bond chart, many things can be understood!
Bullish waves are powerful but corrective waves are tight and weak, we have bullish CH and mCH and the price of the price action structures is well BOS.
If it reaches the green area, it will be a good opportunity to buy
For risk management, please don't forget stop loss and capital management
Comment if you have any questions
Thank You

#Bond On Deamand Analysis#Bond On Deamand Analysis.. It can retrace back to lower box then may be pump up to upper box. If you have any doubt or question comment and DM me.

Are You Ready to Buy some Bond? We Yes**Bond Coin Fundamental**
Bond Coin is a decentralized finance (DeFi) protocol that allows users to earn interest on their assets by lending them to borrowers. Bond Coin is built on the Ethereum blockchain and uses a unique algorithm to determine interest rates.
**Recent News**
* Bond Coin recently launched a new lending pool for stablecoins. This will allow users to earn interest on their stablecoins while also having access to liquidity.
* Bond Coin is also working on a new feature that will allow users to borrow against their assets. This will give users more flexibility with their assets and allow them to generate liquidity without having to sell them.
**Disclaimer**
This is not financial advice. Please do your own research before investing in any cryptocurrency.
Bond Coin is a promising DeFi protocol with a lot of potential. The recent launch of the new lending pool for stablecoins is a positive step, and the upcoming borrowing feature is also something to look forward to. However, it is important to remember that Bond Coin is still a new project, and there is always the risk of loss when investing in cryptocurrency.
**Please do your own research before investing in Bond Coin.**

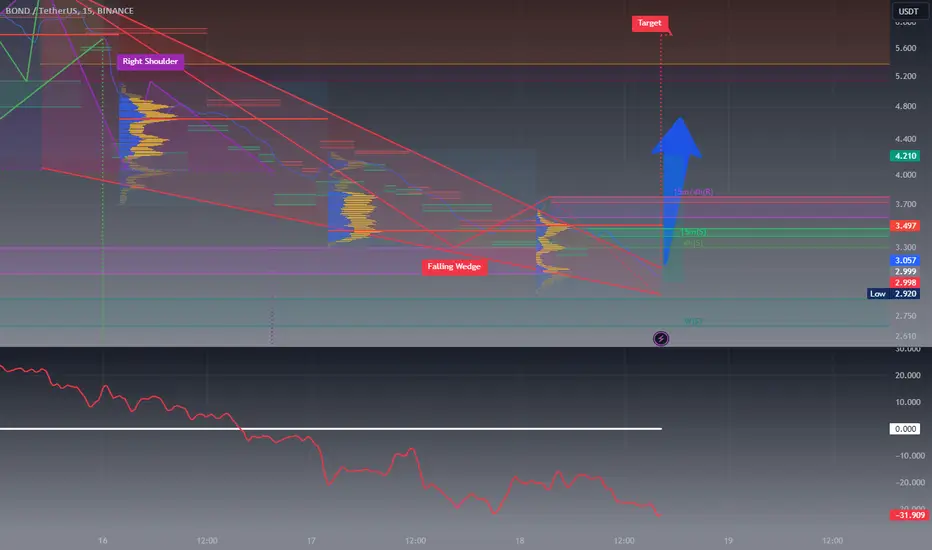
BOND Falling wedgeBOND currently forming a falling wedge on 30mins TF and on 30mins bullish OB… I’m expecting a breakout to the upside for another run…. Wait for breakout and long from there….
Follow for more market update

BOND long and short ideasbond has been respecting an orderblock around 3.90 and has created a downward sloping trendline which created a pennant the target of the pen is the length of the flag pole brings us almost to the previous high. the short idea has a path drawn in yellow this is the minimal i see happening if bears take control we could revisit the support from before the huge move that was made about aweek ago

buy in bull-trend1. Technical Analysis 📈 IN bull-trend
2. Entry and Exit Timing ⏱ Entry in 3.127$
3. Risk Management 🚧 3% capital
4. Trade (Buy/Sell) 📊 buy
5. Stop Loss 🛡 $2.53
6. Take Profit 🎯 $5.6
👨🎓 Experience and Education: Our trading team has five years of experience in financial markets, especially cryptocurrencies.

BONDUSDTBased on the provided data, the BOND currency is currently trading at $4.215 against USDT. In the short term (4-hour chart), it shows a bullish trend with an RSI of 67.30, indicating that it is nearing overbought territory. The MACD is positive at 0.112, further confirming the bullish trend. However, the price is below the Bollinger Band's upper limit (4.278), suggesting room for upward movement before it becomes overbought. The nearest support and resistance levels are at $3.279 and $4.278, respectively.
In the medium term (1-day chart), the trend remains bullish with an RSI of 60.78 and a positive MACD of 0.393. The price is below the Bollinger Band's upper limit (4.887), suggesting potential for further upward movement. The nearest support and resistance levels are at $2.561 and $6.751, respectively.
In the long term (7-day chart), the trend seems less bullish with the MACD turning negative (-0.220), indicating a potential bearish reversal in the longer term. However, the RSI is still in the neutral zone at 59.47, not indicating overbought or oversold conditions. The price is below the Bollinger Band's upper limit (4.444), indicating that it is not overbought in the long term. The nearest support and resistance levels are at $2.763 and $6.624, respectively.
Based on the above, the BOND currency seems to be in a bullish trend in the short to medium term. However, traders should be cautious about potential long-term bearish reversal signals. As always, it's important to consider other factors including market news, overall market trends, and risk tolerance before making any investment decisions.

Growth potential for BONDafter a major correction of a few days, there is growth potential from the area of $2.7 towards the first target of 3.6$
not financial advice!!

Bond rises againLeg 2 started and we can expect the same previous high and beyond. volume is also up.

BOND USDT LONG BREAK OUT falling wedge!
BOND long breakout falling wedge 1e TP 4.2 -> 40%
stop loss 2.95 USD
leverage 5x

Bullish Vibes with CautionAt its current price of 4.433, BOND seems to be in a phase of consolidation following a significant upward momentum. Within the bounds set by the Fibonacci retracement levels, the asset finds crucial support near the 0.236 retracement level at 4.689 USDT. This level's significance is enhanced given its proximity to BOND's current price and prior interactions. On the upside, the 0.5 retracement level at 5.402 USDT stands out as a possible resistance, which could act as a hurdle for any bullish advances.
The bullish shading of the Ichimoku Cloud, combined with BOND's position above it, reinforces the prevailing bullish sentiment. However, a narrowing cloud ahead might be indicative of forthcoming volatility or a possible trend shift.
Combining insights from the MACD and RSI indicators presents a more layered understanding. The MACD, presently below its signal line, signals a bearish bias, suggesting potential consolidation or a minor downturn. This bearish inclination is somewhat mirrored by the RSI, registering at 40.28, indicating it's nearing the oversold threshold, thereby hinting at a possible rebound or trend reversal in the near term.
In terms of volume dynamics, the OBV showcases substantial buying momentum, backing the prevalent bullish tendencies. Yet, a diminishing Volume Oscillator implies a hint of caution, signaling a prospective decrease in buying interest.
Most Probable Scenario: In the short term, BOND may experience a minor pullback or stabilization given the slight bearish indicators from MACD and RSI's approach towards the oversold region. However, with substantial volume backing and its position relative to the Ichimoku Cloud, the medium to long-term outlook leans bullish. Monitoring the highlighted key price levels will be instrumental for potential breakouts or reversals.
Overall Sentiment: Neutral with a Bullish Bias.

BOND going downCoin in the game, increased volumes, activity in the glass.
At the moment, a horizontal short level has been formed on a round number with two touches. Potentially, I expect a preload to the level in confirmation of the breakdown scenario.

BOND Bullish Momentum Alert: Buy LTC for Maximum Gains!BOND is a decentralized finance (DeFi) protocol that allows users to lend and borrow assets at a fixed interest rate. It is built on the Ethereum blockchain and uses a unique bonding mechanism to ensure that borrowers are always able to repay their loans.
**Fundamentals**
BOND is a relatively new project, but it has quickly gained traction due to its innovative design and strong team. The project is led by experienced entrepreneurs and investors, including former Coinbase CTO Balaji Srinivasan.
BOND offers a number of advantages over traditional lending platforms:
* **Fixed interest rates:** Borrowers on BOND can lock in a fixed interest rate for their loan, regardless of market conditions. This provides borrowers with certainty and peace of mind.
* **Decentralized:** BOND is a decentralized protocol, which means that it is not controlled by any one entity. This makes it more secure and tamper-proof than traditional lending platforms.
* **Transparent:** All transactions on BOND are recorded on the Ethereum blockchain, which makes them transparent and auditable.
**Recent News**
On September 20, 2023, BOND announced that it had raised $10 million in a funding round led by Coinbase Ventures. The funds will be used to expand the team and accelerate the development of the protocol.
On October 10, 2023, BOND launched its mainnet protocol. The launch was successful, and the protocol has been running smoothly since then.
**Disclaimer**
Cryptocurrencies are a high-risk investment and should only be invested in by those who can afford to lose their investment.

BOND is flying very high on 7-star buy signal Bond was giving heavy buy signals from yesterday and it's continuing its run even today.
I haven't received any sell signal till now and the next target is under 6.
Enter at appropriate 5 min candle and set the stop loss min 5%
Grab our indicator to cut losses.

BONDUSDT(BarnBridge) Daily tf Range Updated till 14-10-23BONDUSDT(BarnBridge) Daily timeframe range. over 239%+ retrace from local low. thats actually impressive. tried at 5.527 ,but good amount of bagholders there so need more of a push for a actual break.

BOND Momentum AnalysisBOND displays signs of strong upward momentum. After analyzing the indicators and chart patterns, we can glean insights about potential future price action and key levels to monitor.
Indicators and Analysis:
The price action has breached the upper Bollinger Band. This typically suggests overextension in the short term, and the asset might be due for a pullback or consolidation. However, this can also be a sign of strong momentum if supported by other bullish indicators.
Without a clear view of the Ichimoku Cloud, it's hard to provide a precise analysis. However, the Ichimoku Cloud can give insights into future support and resistance levels, so keeping an eye on any potential cloud crossovers will be crucial.
With %K at 64.34 and %D at 71.64, the asset exhibits bullish momentum. However, it's nearing potential overbought conditions, suggesting caution.
Approaching the overbought territory, the RSI at 66.50 indicates strong buying interest, but traders should be cautious of potential reversals if it surpasses 70.
The rising OBV suggests that volume is supporting the bullish price action, indicating strength in the move.
Most Probable Scenario:
The bullish momentum is evident, backed by volume and supported by several indicators. However, given the overextended nature of the move, a short-term pullback or consolidation might be on the horizon before any further upward continuation.
Conclusion:
It seems bullish in the short term, but traders should be cautious of potential overbought conditions. Monitoring the mentioned key levels and setting stop-losses appropriately is advised.

BOND is near resistanceThe BOND symbol has done a sharp pump.
Now it is near a resistance zone. This area is a resistance FLIP range.
Due to the fact that the price of flooring has not been built and has risen sharply, you should be careful in this area.
A dynamic resistor is also passing through the flip region.
Buying in these areas is high risk.

$BOND devaition in progress
reclaim and go ...
weekly close today so gonna wait for a better entry for perps on stuff
for now spot scaled in 25% shall add on a reclaim of white line then look for mid range

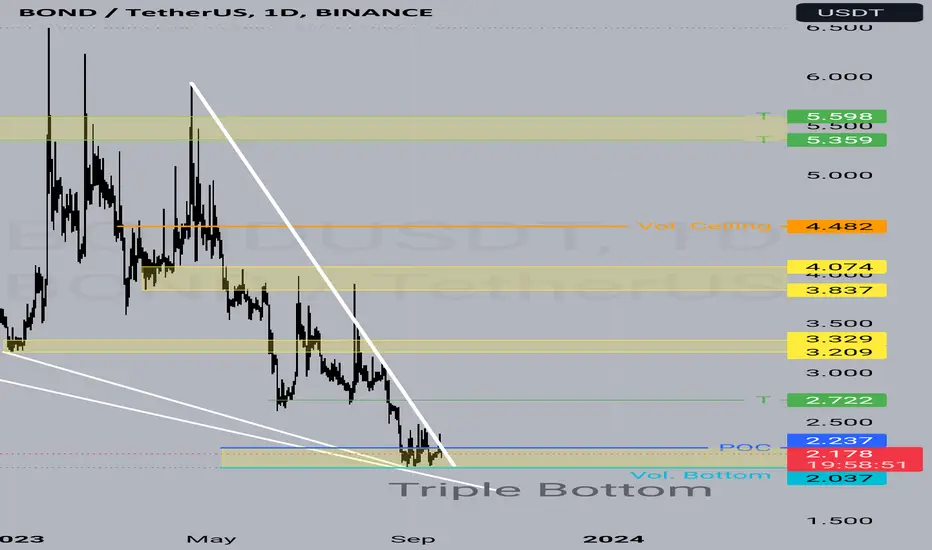
Bond 1d is bullish Bullish Bond is moving and it is considered as hidden gem because of its low circulation supply
It has to close above the trend and the POC as well.
All the best insha Allah!
🚨 Trade Update: BOND/USDT (3-5x)🚨 Trade Update: BOND/USDT (3-5x)
📈 Long Entry: 2.060 - 2.255
OTE (Optimal Trade Entry): 2.150
SL: 1.986
B/E Move: When it moves close to TP2
TPs:
Short Term: 2.300 - 2.400 - -2.600 - 2.800 - 3.000
Mid Term: 3.200 - 3.400 - 3.600 - -3.800 - 3.900
**Disclaimer: Past profits do not guarantee future results.
Is there a risk? Of course. The whole financial market is subject to risk; any fundamental reason or sudden change in the market sentiment can reverse the current market dynamic and cause a loss. Do not take excessive risks which you cannot afford to lose. There is no obligation to take this trade; please avoid the trade if you disagree with the trade analysis.
EDK FORUM TRADING®
