80% Of Time - A Trading Edge You Don't Want To MissDo you want to know why trading with median lines, also known as pitchforks, can be so successful? It’s simple:
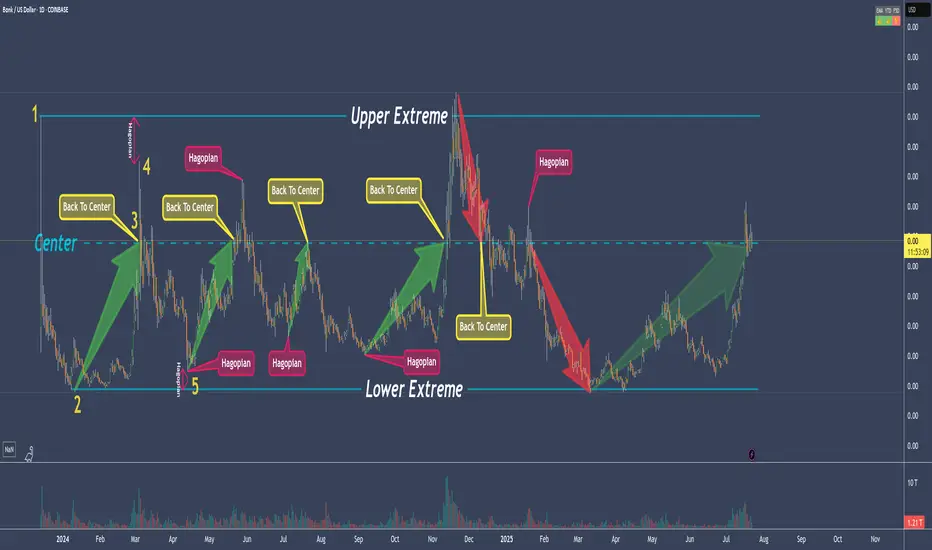
Prices swing from one extreme back to the middle.
From the middle, they often swing to the other extreme.
What do we see on the chart?
- The upper extreme
- The center
- The lower extreme
So far, so good.
Now let’s follow the price and learn a few important rules that belong to the rulebook of median lines/pitchforks, and with which you can make great trades.
Point 1
The price starts and is sold off down to…
Point 2
...and from there starts to rise again, up to…
Point 3
...which is the center. And here we have a rule that is very important and one that you need to be aware of in trading to be successful:
THE PRICE RETURNS TO THE CENTER IN ABOUT 80% OF ALL CASES
If we know this, then we can stay in a trade with confidence.
Point 4
The price climbed even higher but missed the upper extreme.
This is the “Hagopian Rule” (named after the man who discovered it).
And the rule goes: If the price does not reach the next line (upper extreme, lower extreme, or center), then the price will continue moving in the opposite direction from where it originally came.
Phew...that’s a mouthful ;-)
But yes, we actually see that the price does exactly this.
From point 4, where the price missed the upper extreme, the price not only goes back to the center but continues and almost reaches the lower extreme!
Now if that isn’t cool, I don’t know what is!
And what do we have at point 5?
A "HAGOPIAN"!
What did we just learn?
The price should go higher than the center line.
Does it do that?
Oh yes!
But wait!
Not only does the Hagopian Rule apply. Remember?
"The price returns to the center line in about 80% of the cases."
HA!
Interesting or interesting?
So, that’s it.
That’s enough for now.
Now follow the price yourself and always consider which rule applies and whether it’s being followed.
How exactly do you trade all this, and what are the setups?
...one step at a time.
Don’t miss the next lesson and follow me here on TradingView.
Wishing you lots of success and fun!
BONKSOL_HVNWZT.USD trade ideas
Its an ugly Cup & Handle, But one Nonetheless....$BONKThis isn't the prettiest formation of a Cup & Handle but playing out as one currently. A Pick up in volume should send this shit. LFG!
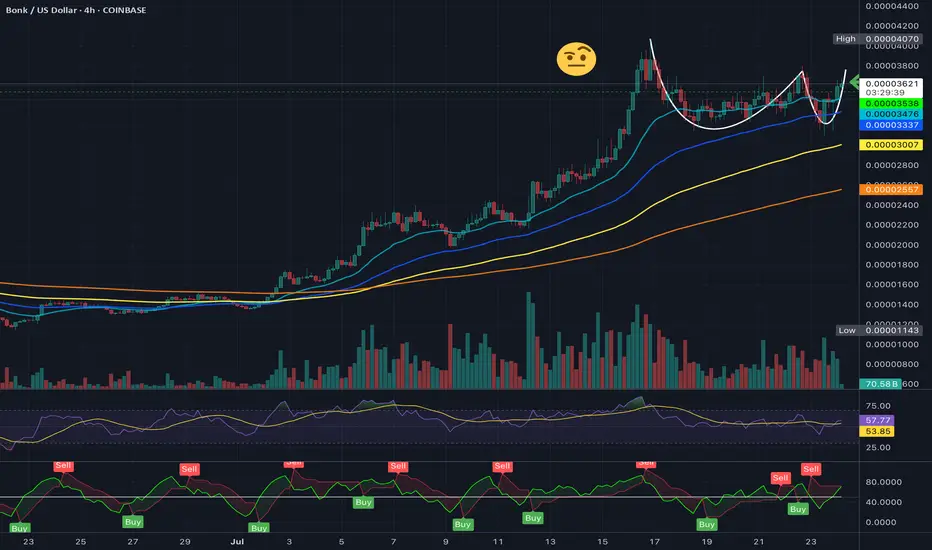
Feels good to be right. But never end up putting enough money on a trade when on right.
Bonk hits target. I wonder if it will break through and go higher or come back down for support?

You've seen it a hundred times but do you not thinkAlchemy never died. It just put on a suit.
They tried turning lead into gold. We turned paper into money and called it policy.
The alchemists had potions. We have central banks.

BONK - Reverse 2.272 ShortBONK #50
Just hit the reverse 2.272.
Most coin charts are either flat or bearish here so BONK has been pumping against the overall market.
This ratio is an algo favourite.
Alerts set above the 2.414 as invalidation but it could go a little higher and still be fine.
That said, I am looking for this to be a tidy catch.
There is no significant bearish wick as yet.
I am shorting this on the basis that I have seen plenty of peaks at this ratio.
I entered a short here 👍.
This analysis is shared for educational purposes only and does not constitute financial advice. Please conduct your own research before making any trading decisions.

Bonk on a tear with fresh volumeBoy this alt market drawdown really taking its toll isnt it?
I think i might of found a relief rally here in Bonk.
Lets see how this prediction plays out

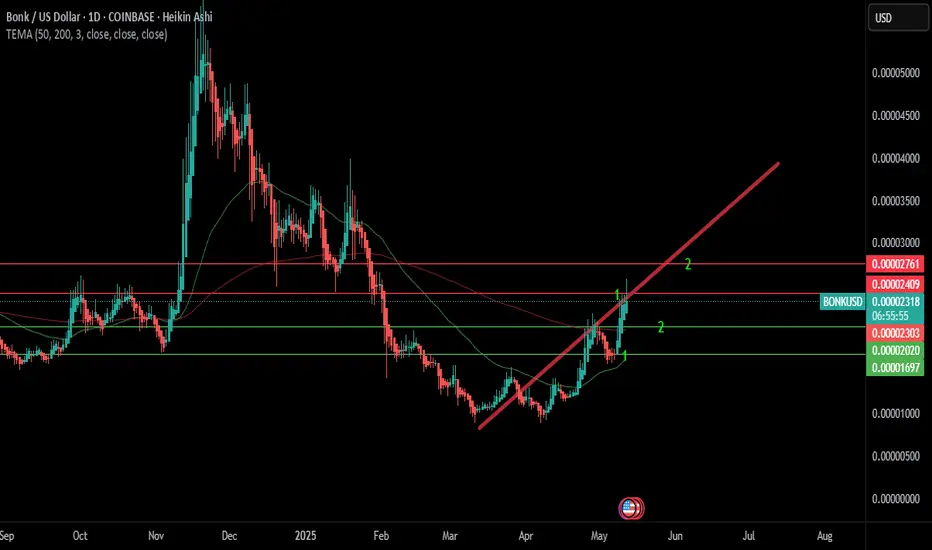
BONK Bullish Reversal in PlayAfter a clean 5-wave advance from the April low, CRYPTO:BONKUSD corrected 55%, then carved out a higher low last month. Now it’s eyeing a breakout above the May peak as the next leg higher begins.

Bonk looks like it can play to the upsideOn the daily time frame, broke out of channel about to come down for a retest. Then up we go hopefully

The world ends in 2050Lines repeat for a reason. In every system whether in nature, society, or the market repetition builds rhythm, and rhythm becomes structure. These patterns aren't random. They're the surface layer of something deeper, something quiet but powerful. Beneath every visible move are supports that hold the entire structure in place. They're not loud, but they're everything. From that foundation, life doesn’t just begin it’s shaped, guided, and often limited.
And this goes beyond structure. There are layers of psychology woven into it. We like to think we’re making independent choices, but our thoughts follow grooves that were carved by those before us. You think you're reacting freely, but often you’re just following a path that's already been predicted.
That’s what the market understands better than most people. It doesn’t just respond to what you do it anticipates what you’re about to do. It moves before you act because it understands how you think. Your doubt, your excitement, your hesitation, your urge to chase none of it is new. It’s all been seen, modeled, and priced in.
By the time you take action, it’s already too late. The move happened while you were still making up your mind. The market feeds on mass behavior, and it knows the tipping point of fear, the peak of greed, and the moment people start thinking in herds.
That’s the deeper game. The market isn’t just numbers and charts. It’s a psychological map one that loops, echoes, and anticipates. Its structure runs ahead of our decisions. The support is buried beneath the story. And from that hidden, repeating foundation, life and chaos unfold with precise rhythm.

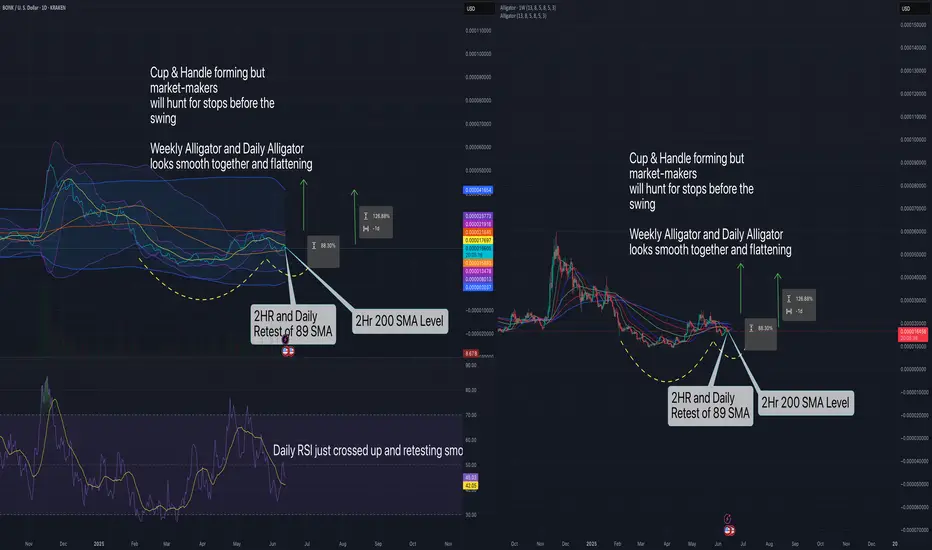
Bonk is readyCup & Handle forming but
market-makers
will hunt for stops before the
swing
Weekly Alligator and Daily Alligator
looks smooth together and flattening
Look at the Bollingerbands as road ways and the 21 MA Median and 89 MA Median as confluence
Bonk 1690% shortI see a breakout, and some 5 waves up wich coul be the endof a abc correction. Also went to the 0.5 fib. So from here it should be a nice 1690% gain

BONK About to Explode or Fakeout? Key Levels Are UnfoldingYello, Paradisers! Is #BONK gearing up for a face-melting rally, or is this just another trap designed for emotional traders?
💎BONKUSDT has recently formed a double bottom, a key reversal pattern that often appears before significant bullish momentum kicks in. This comes after a sustained bearish trend, and we’re now seeing signs of strength re-entering the market.
💎What’s even more interesting, a lookalike of skewed triangle pattern is starting to emerge. These often signal continuation of strength, and when paired with an already bullish reversal, it paints a potentially explosive short-term picture.
💎#BONKUSDT is currently sitting on ascending support around the $0.00001980 level. This zone is further bolstered by the EMA-50, adding extra technical significance. If BONK can continue to hold this level, the price is well-positioned to push higher toward the $0.00002470 mark, a moderate resistance zone that could serve as the next stepping stone in this bullish scenario.
💎If BONK clears this resistance with conviction, momentum could pick up rapidly, opening the doors for an aggressive move toward the $0.00003100 to $0.00003400 region. This is a critical profit-taking zone, not only because of historical resistance but also due to a dense confluence of technical barriers.
💎Zooming into the 12-hour timeframe, BONK has just entered a golden cross formation. This bullish crossover is acting as dynamic support, with the $0.00001800 level becoming an important defensive area for price stability moving forward.
Paradisers, strive for consistency, not quick profits. Treat the market as a businessman, not as a gambler.
MyCryptoParadise
iFeel the success🌴

Long Trade Setup – BONKUSD (Bonk) – 30m Chart!📈
🔼 Bias: Bullish
📍 Entry Price: ~0.00002112
🛑 Stop-Loss (SL): 0.00002042 (below white support zone)
🎯 Target Price (TP): 0.00002369
📏 Risk/Reward Ratio: ~1:2.2
🔍 Technical Highlights:
Double-bottom structure on strong support zone (white line)
Breakout from short-term falling wedge (yellow breakout circle ✅)
Volume base forming with support confirmation
Red zone = previous rejection; green = potential upside magnet
🧠 Trade Reasoning:
Clean breakout after consolidation
SL below structure = logical invalidation
TP hits overhead liquidity and prior highs

Bonk B wave to 24?Bonk, after completing a wave 5 up to resistances is Bonk consolidating down to a weekly support and up again to test resistance before another big drop to monthly support and complete another wave 5 down for another higher low?

futuras entradas y salidas en bonkEntering the green lines and exiting the red lines taking into account that number 1 was already successful
BONKUSD: Keep an eye out for potential breakoutAs above.
Triangle type formation and near end with testing upper resistance line.
Watching for break out especially above 0.000015 level of next resistance.
BONK has potential to pump and dump fast, so going to need to be fast on entry and exit.
1W MACD additionally looking like turning around and bearish trend reversing on that time frame so far.
Will follow.
Good luck traders.

head up : sharktrade the big jaws like the meme coin : BONKevery crypto kids or crypto enthousist know meme coins but in the meme coin you differents kinds the king is BONK , from yesterdeya we have very good pump and this one could double you portfolio every 6 months , it s already the case for me ...

BONK possible movesI am new to the Elliott wave theory and I am just trying to see if the lines I have could be the possible next moves for BONK.
I am looking forward to see comments of those that know and understand Elliott Wave Theory to see if you all see this as a possibility for BONK.
Thanks in advance.

BONK/USD (1H) - EMA Crossover DCA with Advanced ExitsTrade BONK/USD on the 1H chart with this strategy combining trend entry and Dollar Cost Averaging.
Core Logic:
Entry: Long position initiated on Fast EMA crossing above Slow EMA.
DCA: Averages down entry price by placing up to 2 Safety Orders (funded by specific USD amounts) if price drops. Spacing is configurable via ATR multiples or percentage levels.
Exit: Utilizes a powerful Dual Trailing Stop system to manage profits and risk: a standard wide trail, plus a tighter trail that activates once a specific profit target is hit. Also exits if the trend reverses (EMA crossunder).
Key Settings & Tools:
Customize EMA periods, all trailing stop percentages, and safety order logic (ATR/%, Size).
Enable a Date Filter to restrict trading to specific periods.
Set an Entry Cooldown to avoid immediate re-entry.
Includes an Info Table on the chart for key metrics.
Provides alertcondition outputs potentially usable for automation (e.g., 3Commas) - user must verify/adapt message format.

BONKUSD LONG? Will we a see a dump on BONK/USD before it retests the high's and then makes a new higher high?
Curious.... Exciting to see crypto at these prices.
Long BONKUSD
Might see a pull back in the BONK BUYING ZONE.

BONK - 4hr Bullish Trade SetupIf we get two 4hr closes above the key resistance line, then good probability of a move higher. Three potential targets and suggested stop loss.

We have bottomed at Bikini BottomPossibly a great entry right now, as we have hit Bikini Bottom and Spongebob is telling me, there could be a easy 100% to 200% potential gains to be made!!

BONK: Time to BounceBONK has seen a 75% retracement to the downside since November and is currently holding at support. I would expect a bounce to the upper trend line. A clean break of the trend line would cause a huge move to the upside. Keep an eye at these levels.
