BONK gonna go bonkers?Falling Wedge formation in 4h timeframe
If we can hold .00286 to .00278, I'm expecting a sweep at range high around .0034 to .0036
Immediate resistance is around .0032 to .00322, expect some rejection here (vwap line)
BONKUSDT trade ideas
BONK PriceThis week, the BONK crypto price has retested its 100 day EMA mark and might see a pullback ahead.

BONKUSDT is BullishBullish RSI divergence appeared on hourly time frame, which led to the printing of first higher low followed by a higher high, indicating that bulls are trying to win control of the price action. If newly printed higher high is broken, we can expect a bullish rally according to Dow theory. Targets are mentioned on the chart.

#BONK Again Ready To Clear Liquidity and Liquidate Shorter #BONK Again Ready To Clear Liquidity and Liquidate Shorter ...
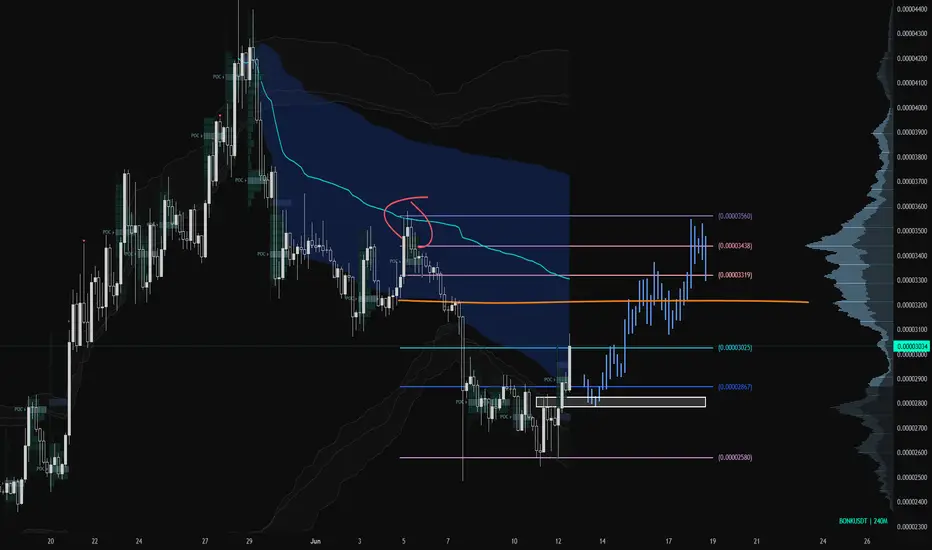
Will be update time by time

$BONK short term symmetrical triangle pattern about to break outUpdate: I have upgraded my account, so now I can do better charts. This is an update of my previous SEED_DONKEYDAN_MARKET_CAP:BONK idea published yesterday. Note that I am selling nothing, not affiliated to anything. It is my personal unbiased trading strategy.
Introduction
SEED_DONKEYDAN_MARKET_CAP:BONK is one of the most explosive memes in the top 100 crypto. Handle with care, as it can blow up at any time. It is the "official" meme of Solana. While, like
CRYPTOCAP:FLOKI , the meme itself is horrible visually, the community is huge and active.
History
SEED_DONKEYDAN_MARKET_CAP:BONK experienced a 30% pullback and is ready to pump again by 29%. If it passes through the $0.00003586 resistance, there is nothing to stop it until $0.00004424.
Chart Analysis
We can see the formation of a short term symmetrical triangle formation that is about to break out. The target of this for this pattern is $0.00003747
It is a meme; it is a very risky idea, so DYOR as always.
We do not recommend the use of technical analysis as a sole means of trading decisions. We do not recommend making hurried trading decisions. You should always understand that PAST PERFORMANCE IS NOT NECESSARILY INDICATIVE OF FUTURE RESULTS.

$BONK / USDT ready for another parabolic move?SEED_DONKEYDAN_MARKET_CAP:BONK is one of the most explosive memes in the top 100 crypto. Handle with care, as it can blow up at any time. It is the "official" meme of Solana. While, like CRYPTOCAP:FLOKI , the meme itself is horrible, the community is huge and active.
SEED_DONKEYDAN_MARKET_CAP:BONK experienced a 30% pullback and is ready to pump again by 29%. If it passes through the $0.00003586 resistance, there is nothing to stop it until $0.00004424.
The Ichimoku Cloud is again in the green, and the two lines have crossed, which is bullish on a 1-hour timeframe.
There is a directional trendline showing the potential for a parabolic move, if it happens.
Right now, SEED_DONKEYDAN_MARKET_CAP:BONK is crippled by a 1-hour bearish MACD, so we might see some pullback to the support at $0.00003335.
If CRYPTOCAP:BTC continues its uptrend, there is no reason why this would not happen.
It is a meme; it is a very risky idea, so DYOR as always.

A flash dump is possibleAs we can see, Bonk broke through its consolidations with strong buying power. however, meme coins tend to have much higher volatility, right now it has peaked almost to ATH and going down to the previous resistance level for a retest. Where I believe would have a quick flash dump to get the liquidity and then the candle will soon recover back to the top. Traders should be careful about their SL where they thought it would be safe to place under the resistance.
If the flash dump comes true, but the candle failed to show strong recovering power, then bonk would heading lower to its previous resistance of the consolidation phase for more liquidity grab. But if it recovered fast and the market provides with a second green candle for confirmation, then bonk would reach its new all time high. I would place a "risky" long position where the majority of the trader would place their SL.

BONK ready to flyAs we can see bonk has already broke out of the inverse H and S pattern and is back here to retest the support zone, on a good bullish candle ( in the green zone marked ) would be a good entry point for bullish continuation.

BONK: Pullback in UptrendTrade setup : Price is in an Uptrend. Following a bullish breakout from Ascending Triangle, price got close to our near-term target of $0.000046 for +50% gain. Price got overbought (RSI > 75) got rejected at that resistance level and pulled back on some profit taking. Pullback to $0.000030 could be an attractive swing trade entry in Uptrend with +20% upside potential back to $0.000037 or +50% to $0.000046.
Pattern : Pullback in Uptrend. Price remains in an Uptrend but has pulled back, which could present a 'buying dip' opportunity. Traders should look for the nearest support level where price could stabilize and resume its Uptrend. This support level could be a level where price bounced off of in the past, or a level that was previously resistance. (concept known as polarity).Learn to trade key levels in Lesson 3.
Trend : Short-term trend is Up, Medium-term trend is Strong Up and Long-term trend is Strong Up.
Momentum : Price is neither overbought nor oversold currently, based on RSI-14 levels (RSI > 30 and RSI < 70).
Support and Resistance : Nearest Support Zone is $0.00003, then $0.00002. Nearest Resistance Zone is $0.000037, then $0.000046.

$BONK continues to copying $PEPEIn my opinion SEED_DONKEYDAN_MARKET_CAP:BONK is one of the strongest meme coin in this bullrun. It currently sitting no.54 on coinmarketcap. With $ 2.17B market cap

BONK Price Stumbles After Hitting ResistancePopular meme coin BONK is facing a price correction after encountering resistance at the $0.00002705 level on the daily timeframe.
The next support level for BONK is anticipated to be around $0.000022. If the price falls below the current level, it could indicate a further decline in the short term.

Bonk Chart. Too good not to trade. Market moved too fast for me to enter at my desired entry price. One look at the chart and I'm regretting sleeping already.
Anyways chart shows clear accumulation throughout the 6 months. To me Bonk is entering the Banana Zone.
Godspeed.

BONK: Massive Inv. H&S pattern forming! It seems like the price is forming a massive Inv. head & shoulder pattern, and now may be the time to keep an eye on BONK! If you're looking to trade BONK at the moment, here's a quick setup that you might find helpful!
The idea is: Buy when the price breaks above $0.00002675 and take profits at the levels shown in the chart.
Targets:
1. $0.0000275
2. $0.0000295
3. $0.0000315
-------------------------------------------
About our trades:
Our success rate is notably high, with 10 out of 11 posted trade setups achieving at least their first target upon a breakout price breach (The most on TW!). Our TradingView page serves as a testament to this claim, and we invite you to verify it!

BONK Weekly AnalysisBonk BINANCE:BONKUSDT is the top loser of the week, experiencing a 27.29% correction. Despite this, Bonk has shown a consistent pattern of corrections and surges.
There is a significant resistance zone between $0.00003975 and $0.00004798. Bonk has attempted to break through this zone three times. On May 28, 2024, Bonk tried to reach its all-time high (ATH) but was quickly rejected and is currently trading at $0.00003213.
It appears Bonk is finding interim support to retest the ATH. If Bonk breaks its ATH and closes above that price level, we can expect a further rally.

Bonk- buy signalIt seems that BONK reached the end of the triangle and if the breaks, it will continue its movement that started last year.
Good for buy and no risk

BONK PriceThe Bonk (BONK) crypto has experienced rejection from the supply region and delivered a fake breakout this week.

YOU WILL RICH (BONK COIN!) BY WHALES STEPIn conclusion, the notion that one will become wealthy through "BONK COIN" due to the actions of whales should be approached with caution. While large investors, or "whales," can influence the price of cryptocurrencies, investing solely based on their activities carries significant risks. It's essential to conduct thorough research, consider the inherent volatility of the cryptocurrency market, and develop a well-rounded investment strategy that aligns with your financial goals and risk tolerance.

12R | Most likely it would never succeedRSI Divergence on 1HR, also on a trend line, SOL seems bullish to me atm... Probably a wider SL would be better.


BONK priceThe Bonk (BONK) crypto has registered a rounding bottom formation breakout and trades in the bullish trajectory.

$BONK / USDT: Bullish trading plan, x10-x20 potentialWhat is SEED_DONKEYDAN_MARKET_CAP:BONK ?
SEED_DONKEYDAN_MARKET_CAP:BONK is a Solana-based meme coin that aims to serve as the “community coin of Solana,” according to its whitepaper.
Facts
- SEED_DONKEYDAN_MARKET_CAP:BONK is available on Binance and all major DEXs, such as Binance and Coinbase, for example. It holds the top position among coins on Solana and is managed by an anonymous team.
- Market Capitalization: $1,582.10M
- Circulating Supply: 63,823,117,391,692 BONK
- Maximum Supply: 93,082,000,358,974 BONK
- SEED_DONKEYDAN_MARKET_CAP:BONK boasts over 700,000 holders, with one whale owning 10% of the tokens.
These numbers suggest that SEED_DONKEYDAN_MARKET_CAP:BONK is undervalued compared to SEED_DONKEYDAN_MARKET_CAP:FLOKI , CRYPTOCAP:SHIB , or $PEPE. It is listed on all major exchanges, including Coinbase (where CRYPTOCAP:PEPE is not).
Analysis
Despite its unattractive design and limited popularity as a meme on Twitter, I remain bullish on SEED_DONKEYDAN_MARKET_CAP:BONK for several reasons:
1- SEED_DONKEYDAN_MARKET_CAP:BONK experienced an explosive rise to $0.000095 before undergoing a correction.
2- The price has now touched the 0.5 Fibonacci retracement line and entered the golden channel
3- Fibonacci retracement zone, indicating the end of the correction.
4- Fibonacci extension suggests a surge to the following target prices:
TP1: $0.00002940
TP2: $0.00003030
TP3: $0.00003190
Conclusion
Barring a black swan event (with rug pulling being the main risk in the meme coin space), this coin should perform well throughout this bull market, potentially offering a x10-x20 return on investment.
This is not an investment advice, DYOR. Also zoom in to see the details of the Fibonacci.
Post your profits in the comments!

BONK/USDT: Targeting Upside Breakout, Buy Stop at 0.00003700BONK/USDT is primed for a breakout from its ascending triangle formation. We're setting a buy stop at 0.00003700 to capture the potential bullish momentum. With a risk/reward ratio of 1:2, this trade is positioned to take advantage of the upward trend continuation. This setup aims to ride the breakout to new highs, capitalizing on the increased buying pressure indicated by the recent price action. Ensure to manage your position by monitoring the breakout strength and adjust stop losses accordingly.

BONK/USDT on the Brink of a Major Bullish Breakout | Watch Out👀💎Paradisers, #BONK is at a pivotal moment as it attempts to break free from a descending channel, supported by the 100-day & 50-day moving averages—a promising sign of an upcoming bullish surge.
💎We're anticipating a slight pullback to gain the necessary momentum to smash through the descending resistance. Once it conquers this barrier if SEED_DONKEYDAN_MARKET_CAP:BONK manages to hold its ground in this zone, expect a strong push towards and possibly beyond the major resistance levels.
💎However, the markets are fickle, and caution is paramount. If BINANCE:BONKUSDT cannot maintain its momentum and dips below the key demand level of $0.00002073, this could spell trouble, indicating a potential weakening of the bullish trend. In such a scenario, a rebound from the next critical support at $0.0000182 might be our saving grace, though breaching this could lead to a significant downturn.
💎Your ParadiseTeam is closely monitoring every development to guide you through this market. Stay prepared to make your move and capitalize on the opportunities that #BONK presents.
MyCryptoParadise
iFeel the success
