BONKUSDT: Bullish Setup Brewing! Are You In?#BONK is flashing strong bullish signals on the 1D timeframe:
Double Bottom Pattern – A textbook reversal signal
Break & Retest of Key Resistance – Now acting as solid support
Price at CMP (Current Market Price) – In the ideal buy zone
This confluence of signals suggests momentum is shifting in favor of the bulls. If volume kicks in, we could see a sharp breakout toward the next resistance levels.
Trade Plan:
Entry: CMP
SL: 0.00000886
Target 1: 0.00002607
Target 2: 0.00003989
Always use proper risk management!
What’s your view on #BONK? Bullish or Bearish?
Drop your thoughts in the comments and let's discuss!
Don’t forget to like and follow for more setups!
#BONK #Crypto #Altcoins #TechnicalAnalysis #Breakout #DoubleBottom #TradingView
BONKUSDT trade ideas

Bonk Price is up 30%The price of CRYPTOCAP:BONK Coin has reached double its demand, where lies the resistance – Major Change of Character.
Read more here:
www.cointrust.com

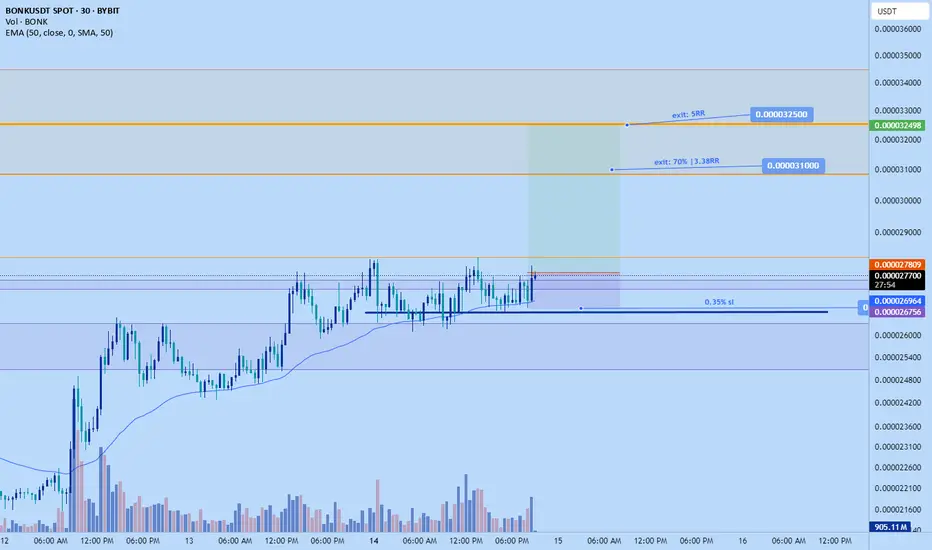
Bonk long to $0.0000325Just now hopped into a long position on bonk. Aiming for $0.0000325. However looking to scale out 70% around $0.000031.
Breakout likely to happen soon, maybe next hr based on my DTT analysis
Stop: $0.000026756 or lower
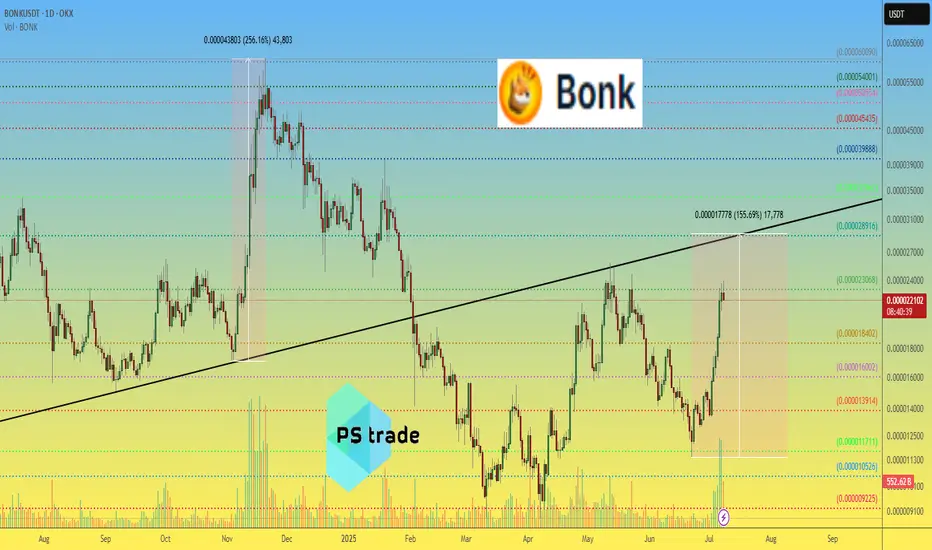
BONK price analysis “Someone” decide to revive the price of CRYPTOCAP:BONK , or are there fundamental reasons for this? (Please share your thoughts in the comments.)
📈 However, the last time there was such a powerful surge in trading volume on the OKX:BONKUSDT chart, the price managed to gain +256% in just over two weeks.
❓ Do you think that the price of #Bonk , in the current wave of growth, will manage to rise by at least +156% and reach the mark of $0.0000290, and the capitalization of the memecoin project will grow from the current $1.75 billion to $2.25 billion?
_____________________
Did you like our analysis? Leave a comment, like, and follow to get more
BONK BONKUSDT Hello, greetings...
🐱🐉 The support and resistance levels in Bonk during the 4-hour timeframe are shown in the graph as I have indicated.
🐱🐉 However, what I want to discuss with you is how we should follow Bonk and how we can maintain control over its strength. I will show this to you...
🐱🏍 First, let's just look at the support, resistance, and our trend...
🐱🏍 When we look at it, we see a strong upward trend showing rapid growth and there is both a support level and a resistance level. It appears that the upward trend will continue until we reach the yellow line. When we reach the yellow trend, the color of things will change.
🐱👤 What I want to explain most to you is the indicator part now...
🐱👤 The blue arrow marks indicate the strength of the trend, the white line is called ADX, which shows how strong the trend is. The purple one is the well-known RSI,
🐱👤 So what is ADX telling us right now?
🐱👤 ADX is still looking upwards and at a high level, so it makes more sense to hold on to our long positions.
🐱🚀 The indicator we know as DI+ and DI- consists of green and red thin lines. What does it tell us?
🐱🚀 If DI+ (green) crosses above DI- (red), it indicates a positive trend and we are currently seeing a significant positive movement. We will use this indicator like this: if ADX turns downward and DI- crosses above DI+, those who are holding long positions should be cautious.
CONTINUE TO HOLD THE POSITION
+DI > -DI
ADX > 25
RSI < 70 → Should not be in an overbought area
BE CAUTIOUS
-DI > +DI
ADX > 25
RSI > 30 → Should not be in an oversold area
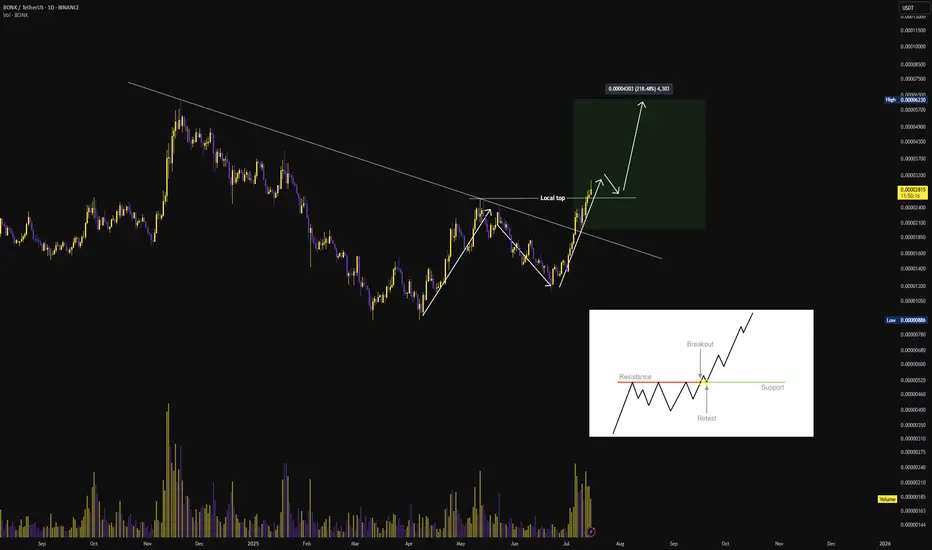
$BONK Breakout and Retest Structure
BONK has executed a clean breakout above the multi-month descending trendline, supported by increasing volume and momentum. The asset has also reclaimed the prior local top, indicating a structural shift in market direction.
Price is now approaching a critical retest zone near the breakout level. If this area holds as new support, it would confirm the breakout and validate the bullish continuation setup.
Measured Move Target: 0.00004303
Potential Upside: ~218% from retest confirmation.
A successful retest followed by bullish price action would reinforce the breakout and open room for further expansion.
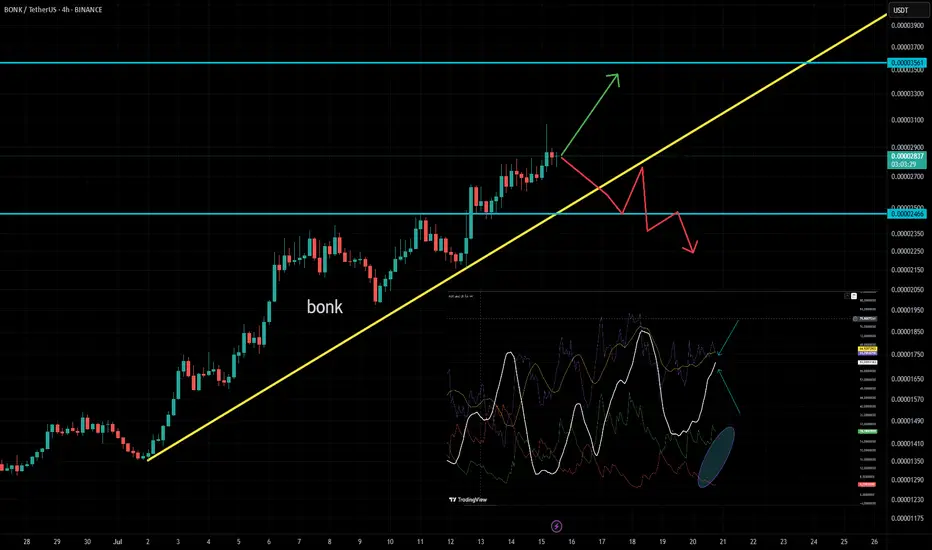
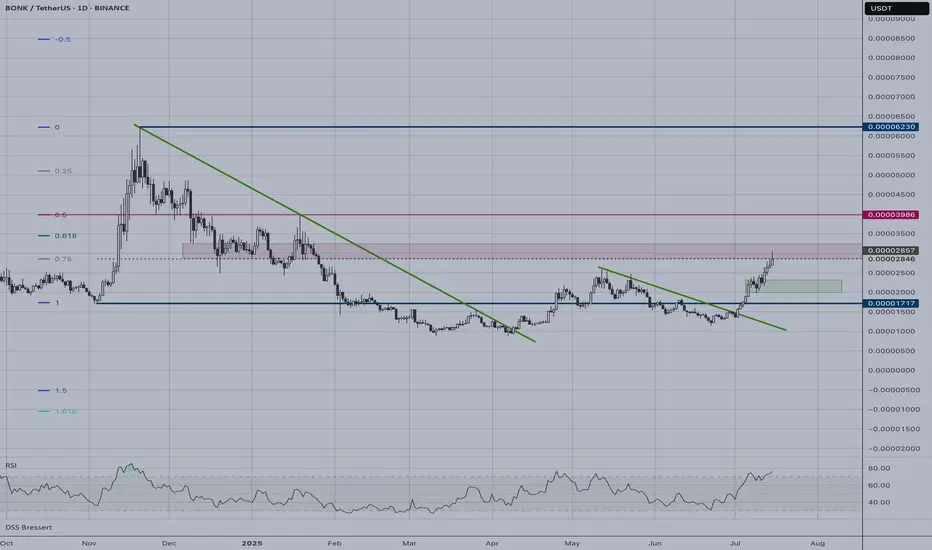
BONK | Time for a PullbackBONK is showing signs of exhaustion after its recent breakout above the descending trendline. The price has reached a key resistance zone around 0.00002854, which aligns with previous highs from earlier in the year.
Key Technical Signals:
RSI approaching overbought levels near 80
Price struggling at major resistance confluence
Volume appears to be declining on recent advances
Long-term descending trendline now acting as potential support
Pullback Scenario:
The most likely correction target would be the green support zone around 0.00002000-0.00002100, which represents:
Previous resistance turned support
50% retracement level
Confluence with broken trendline
Risk Considerations:
Crypto markets can remain overbought longer than expected
Strong momentum could push price to next resistance at 0.00003986
A break below 0.00001717 would invalidate the bullish structure
The setup favors a healthy pullback before any continuation higher, making this an ideal zone to wait for better entry opportunities.
Technical Analysis of Bonk CryptocurrencySeveral factors, including the potential approval of a BONK ETF and the planned burn of 1 trillion tokens upon reaching 1 million holders, have contributed to BONK’s recent price surge.
The price is expected to move toward 0.000035 in the coming days, driven by increasing buying pressure and demand.
However, there’s a high probability of a correction around that level.
As long as the price remains above 0.0000245, the trend remains clearly bullish.
This is not a buy recommendation — it’s purely a technical analysis.

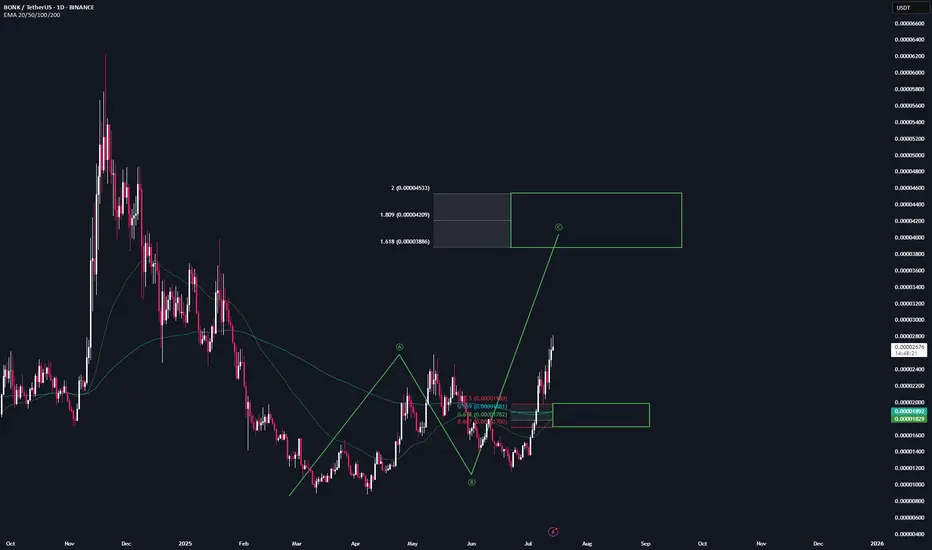
BONK | Trade Setup📌 After the breakout from the last high, a bullish sequence (green) has now been activated.
📊 These setups typically occur no more than twice per year on any given altcoin, so I’ll be aggressively buying each level at the B-C retracement area.
Trademanagement:
- I'm placing long orders at each level. ((If the price continues climbing, I’ll adjust the trend reversal level (green) accordingly and update my limit orders.)
- Once the trade reaches a 2 R/R, I’ll move the stop-loss to break-even.
- From a 3 R/R onward, I’ll start locking in profits.
✅ I welcome every correction from here on —
but I won’t enter any new positions at these top levels.
Stay safe & lets make money
Bonk FLYBonk
BONK is a meme coin launched on Solana in December 2022, distributed to build community and liquidity within the ecosystem
Everything is clear on the chart.
It's time to fly.
I wish everyone abundant profits.
Like and follow
for more.

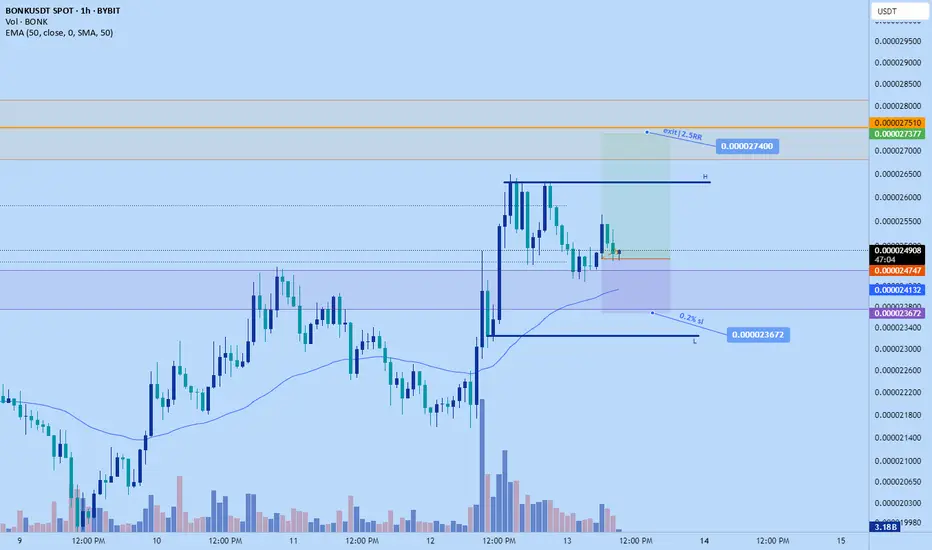
Bonk long to $0.0000274 todayJust now opened up a long position on bonk. Aiming for $0.0274 area
Stop: $0.000023672
roughly 2.5RR from my entry.
Market is at a good area of potential support. Its prior daily resistance that held very strongly in the past and was broken recently with a lot of volume, already gave some signal to long from earlier and return so no need to wait for additional confirmation. Whales likely to defend here from lower prices.
BONK – Long Here, Patience RequiredTime to go long on $BONK.
Hard not to bid at this level—the risk/reward is solid.
Still expecting some range-bound price action before the real move kicks in, so patience is key here.
First target: the yearly open—nearly a 2x from current levels. BINANCE:BONKUSDT

Bonk In A Good Situation, Breaking Resistance & HigherThe market bottom happened 7-April, it was a double-bottom compared to 11-March 2025. The end of a downtrend signals the start of an uptrend, and BONKUSDT started rising next. Resistance was found mid-May, on the twelve. This led to a correction and the correction ended 22-June as a higher low.
Now, between the first low in March and present day we have more than four months. The entire downtrend on the chart lasted 111 days, less than four months. This means that the bullish bias is already bigger in duration compared to the previous bearish wave, and, prices are set to continue higher because BONKUSDT just produced a higher high compared to May. Resistance has been compromised and this is good because it means we can soon experience additional growth.
The path is clear for rising prices. As resistance gets challenged in becomes weaker, as resistance weakens more buy-orders continue to pile up. The more buyers the better the market and then comes a new major high. The advance that is developing now will continue for months and months and months.
Are you ready for huge profits? I hope you are. Crypto is going up!
Namaste.

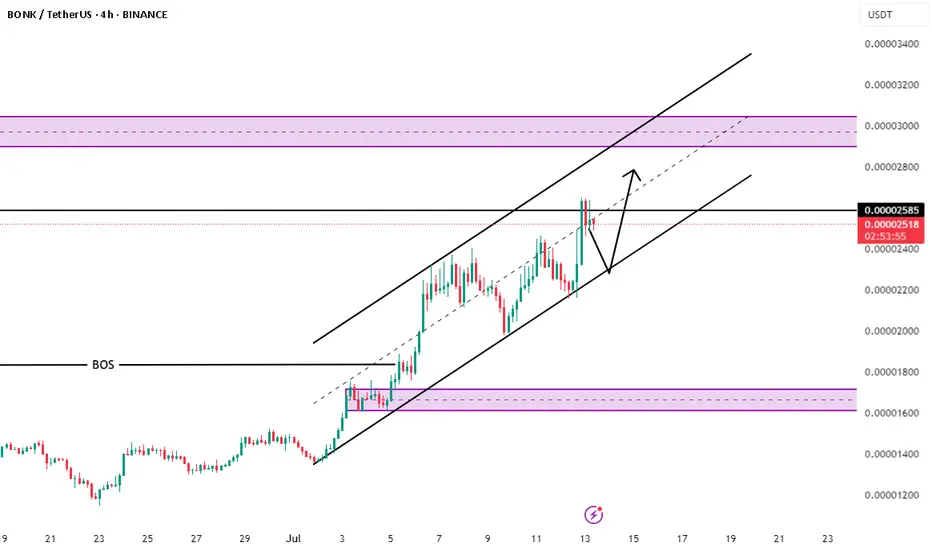
BONK/USDT – Bullish Continuation Setup Forming!🚀 BONK/USDT – Bullish Continuation Setup Forming! 📈
BONK has been moving beautifully inside a well-defined ascending channel on the 4H timeframe, respecting both structure and momentum.
After a strong push to the upper mid-range, price is now cooling off — which looks like a healthy pullback rather than weakness. If the lower trendline support holds (around 0.00002380–0.00002420), we could be gearing up for the next leg higher! 🔥
🧠 Key Technical Highlights:
✅ Trend: Clearly bullish – riding within a rising channel
✅ Current Setup: Possible retest of channel support zone
✅ Structure-Based Target:
TP1: 0.00002700 (mid-channel reaction)
TP2: 0.00003000–0.00003150 (major resistance zone)
🛡️ Invalidation: A clean break below channel (~0.00002300) would invalidate the bullish bias.
🔍 Levels to Watch:
Support Zone: 0.00002380 – 0.00002420 (ideal long entry zone)
Major Resistance: 0.00002980 – 0.00003150 (target zone)
Demand Zone Below: 0.00001700 (if structure fails)
📌 Summary:
This setup looks promising for a trend continuation — as long as the channel structure is respected. Watching closely for a potential bounce at the lower boundary. This is where smart money often steps in. 🚀
👍 Liked the setup? Smash that “Like” & drop your thoughts below!
🐦 Real‑time charts & scalps → Follow on X: @Ali15349323
🔔 Hit “Follow” on TradingView for more high‑probability plays.
*Not financial advice – educational content only.
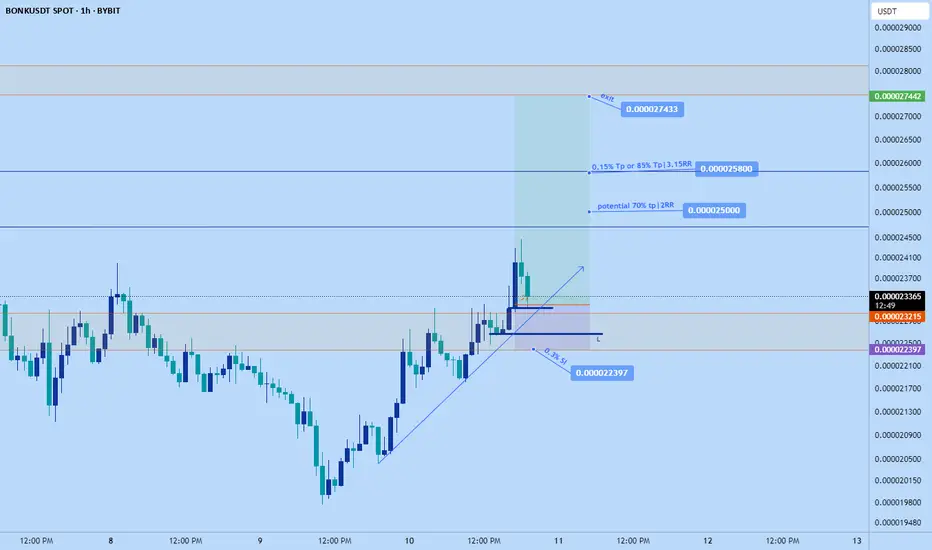
Bonk pump continuationJust opened a long on bonk again.
Stop: $0.022397
Tagets are on chart.
Time sensitive
Will BONK hit 36% gain and reach 0.000020 soon?Hello and greetings to all the crypto enthusiasts, ✌
let’s dive into a full analysis of the upcoming price potential for BONK 🔍📈.
BONK shows strong potential as it approaches a key breakout point. The price is testing the upper boundary of a descending channel, and a successful breakout could push it toward the daily resistance level. 🚀 From here, the trade offers a possible upside of around 36%, with the main target at 0.000020.⚡
🧨 Our team's main opinion is: 🧨
BONK is set to break out of its downtrend with a potential gain of 36%, targeting 0.000020—get ready for a strong move upward 🚀
✨ Need a little love!
We put so much love and time into bringing you useful content & your support truly keeps us going. don’t be shy—drop a comment below. We’d love to hear from you! 💛
Big thanks , Mad Whale 🐋

Bonk short its too highJust went short on bonk. Its been pumping like crazy for a while but today closed bearish on the daily and lower tf like 4hr and 1hr tf flipped back bearish already.
So expect dump soon.
Tp1: $0.02094
Exit: $0.02
2-4RR

BONK BBTrend Flips Positive After 30 Days — Bullish Momentum InBONK’s BBTrend indicator has just flipped positive for the first time in 30 days, potentially signaling the start of a new bullish phase. This is a notable shift, especially after a prolonged period of low momentum and sideways consolidation.
The BBTrend indicator is used to measure both the strength and direction of a market trend. When its value is negative, it typically suggests bearish or neutral conditions, where sellers dominate or price action lacks clear direction. For the past month, BONK has been stuck in this zone — until now.
This fresh flip into positive territory suggests that buying pressure is beginning to outweigh selling pressure, with momentum gradually shifting in favor of the bulls. If this trend continues, BONK could be gearing up for a sustained rally in the days ahead.

BONK: ETF Speculation Ignites RallyBONK, the Solana-based dog-themed memecoin, is back in focus after surging over 50% in the past seven days. It’s currently trading around $0.000022, with strong bullish momentum building behind the scenes.
The main catalyst? Mounting speculation around a 2x leveraged BONK ETF. Tuttle Capital Management recently confirmed July 16 as the earliest possible launch date, pending regulatory approval. This has fueled investor optimism, pushing both price and trading volume sharply higher.
In the last 24 hours alone, BONK's trading volume has jumped over 75%, topping $3 trillion. A simultaneous surge in price and volume typically signals growing market interest and strengthens the bullish outlook.
If this momentum holds and ETF expectations remain intact, BONK could see further upside in the coming days. A short-term target sits around $0.000025, especially if buyer pressure continues to build.

BONKUSDT Forming Descending TriangleBONKUSDT is rapidly emerging as a favorite among traders looking for high-growth meme coins with serious upside potential. This coin has recently shown strong price action, supported by healthy volume that signals growing investor confidence. The market sentiment around BONK has been increasingly bullish, and with current patterns aligning well with a potential breakout, traders are eyeing an impressive 90% to 100% gain from its current levels. Such explosive potential makes BONKUSDT one of the standout opportunities in the altcoin space right now.
As the crypto community continues to embrace meme coins, BONK has carved out a unique space with its vibrant community and strong social engagement. This coin’s popularity on social platforms is fueling its liquidity, and the recent accumulation phases suggest that smart money may be positioning for the next wave up. Technical traders should pay close attention to how BONKUSDT reacts at key resistance zones, as a confirmed breakout could open the door to a major rally in the coming weeks.
The technical structure shows BONKUSDT maintaining its trend above critical support levels while forming higher lows — a promising sign of sustained upward momentum. Traders are watching for a decisive move above recent swing highs to confirm the bullish continuation. With solid volume backing up these moves, there’s a strong chance that BONK will reward patient holders with substantial returns. Keep an eye out for breakout candles and spikes in trading volume as potential signals for entry.
✅ Show your support by hitting the like button and
✅ Leaving a comment below! (What is You opinion about this Coin)
Your feedback and engagement keep me inspired to share more insightful market analysis with you!

Buy Trade Strategy for BONK: Exploring Solana's Meme PowerDescription:
This trading idea highlights BONK, a meme-based cryptocurrency built on the fast and low-cost Solana blockchain. As one of the first major meme tokens in the Solana ecosystem, BONK has captured the attention of retail investors and traders, driven by a strong community, viral marketing, and integration into Solana-based dApps. Its tokenomics support deflationary mechanics and wide distribution, helping fuel adoption and engagement. BONK also benefits from Solana’s scalability, making transactions fast and cheap, an attractive feature for speculative and high-frequency trading environments.
Despite its playful branding, investing in meme tokens like BONK carries a high level of risk due to their reliance on social sentiment, market trends, and community hype. Their price movements can be extremely volatile and unpredictable, often lacking the stability of fundamentally-backed assets.
Disclaimer:
This trading idea is for educational purposes only and should not be taken as financial advice. Meme cryptocurrencies such as BONK are speculative and involve substantial risk, including the potential for total capital loss. Always do your own research, understand your risk tolerance, and seek guidance from a financial advisor before making any investment decisions. Past performance does not guarantee future results.

From BONK to Boom: Is This a Full Impulse?If you find this information inspiring/helpful, please consider a boost and follow! Any questions or comments, please leave a comment!
BONK: Watching the Impulse Unfold
Looks like BONK may have bottomed at 887, where it kicked off what appears to be an impulsive move up.
The retrace that followed was suspicious—plenty of ways to count it depending on your lens—but price action eventually started hinting at a 12-12 or zigzag-style crossroad. That indecision resolved quickly once BONK cleared 1511, shifting the structure firmly back into bullish territory.
Now trading around 2242, the behavior is aligning with what you'd expect from a wave 3: strong momentum, vertical lift, and minimal resistance. It’s moving like a third wave should.
That said, there’s some heavy resistance sitting overhead at 2506, and it could stall or even reject price short-term. If it does, the next thing I’ll be watching is how price reacts—specifically looking for a clean wave 4 pullback and a final push into wave 5.
If we see that 4–5 structure play out at multiple degrees, it would go a long way toward confirming this whole move as a completed impulse off the low.
For now, this one stays on watch for the next setup.
Trade Safe!
Trade Clarity!

BONK/USDT Forms a Bullish Pattern, Is $0.00003, the Next PitstopBonk (BONK), Solana’s breakout memecoin, is once again attracting market attention as it gains upward momentum amid fresh hype surrounding potential ETF exposure and token burn events. Trading at approximately $0.00001874, BONK has climbed steadily in recent sessions, rising over 20% from weekly lows near $0.0000158—an encouraging sign for meme-token bulls.
Despite the recent selling pressure, the BONK price remains within bullish influence as the token surges $0.00001558 and $0.00001627
The momentum is rising as the price is approaching the upper resistance of the Gaussian Channel, and a rise above the range could flip the prevailing bearish trend
On the other hand, the CMF is rising and sustaining above 0, hinting towards the rise in the money flow onto the platform
Therefore, if the BONK price manages to rise above the channel, it may reach the neckline of the double-bottom pattern at $0.00002776, slicing above the pivotal resistance between $0.00002495 and $0.00002632
