BONK/USDT - Bullish Signs
Show some strong signs:
1- Break 4H 200 ma
2- Break VWAP
Price Target
3091
3394
BONKUSDT_2F74AD trade ideas

BONK planning to BREAK BARRIERS...This chart visual should say it all. NO EXPLANATION NEEDED.
The current price point will soon be archived -- history soon.
Expect some significant PRICE SHIFT to the upside.
KEY NOTES:
MASSIVE MASSIVE ACCUMULATION ON WEEKLY.
HIGHER LOWS CREATION ON HISTOGRAM (WEEKLY DATA).
*Again these are ideas, the coin is very volatile still. play it with safety -- even if signs are showing hints.
TAYOR.
Safeguard capital always.

BONK LOOKS VERY BULLISH AFTER I SAW THIS!Played around with the #FRVP tool and loving it.
The red lines are the POC for the previous months.
You can clearly see where the highest amount of volume has been traded over the past 5 months.
We are now above it! This is very bullish for #BONK as long as we stay above it! #Memecoin
Calculate Your Risk/Reward so you don't lose more than 1% of your account per trade.
Every day the charts provide new information. You have to adjust or get REKT.
Love it or hate it, hit that thumbs up and share your thoughts below!
This is not financial advice. This is for educational purposes only.

BONKUSDT 2DBONK ~ 2D
SEED_DONKEYDAN_MARKET_CAP:BONK We are still bullish on this $Meme.
We consider buying inside this pattern. target at least 15%+ from here.

Bonk short retest and ready for another uptrendBonk seems to be leading this bounce with a firm uptrend and isnt done yet.

Bonk price has been in consolidation for 5 months. Medium tradeStill, capital has been not investing in fundamental technology coins.
That's why we are looking at memecoins 😱
Perhaps #BONK is a memecoin worth watching. Despite the fact that the market cap is $1.8 billion, # OKX:BONKUSDT price is adjusting/consolidating quite harmoniously.
The chart shows a medium-term trade option for CRYPTO:BONKUSD
And then, risk management is up to you)

BONK - Ascending TriangleIt looks like Bonk has continued to create beautiful market structure on the daily timeframe.
We see what looks like and ascending triangle forming (example on bottom right).
This is also in confluence with:
-RSI Bottom (yellow line/ green arrows)
-Hidden Bullish Divergence (higher highs in price, same low on RSI)

BONKUSDTWe can attempt to short BONKUSDT from specified level as it break HL , also making rising wedge pattern (reversal pattern) , also there is bearish divergence occur indicate that it moves downward.
SL , TP mention in chart.

BONKUSDT.PBONKUSDT.P Just enter the bearish trend.
just broke the lst HL and made First LL.
Bearish divergence also shown in RSI>
We wait for further more confirmation if it broke the last LL.

long setupDO NOT FORGET USING A STOP LOSS
Warning:
This is just a suggestion and we do not guarantee profits. We advise you analyze the chart before opening any position.
I hope you are always profitable

BONKUSDTBONKUSDT.
Will BONKUSDT get bids from buyers ?
As the price is at strong support level and bullish divergence indicating the buyers may attack this zone. If this happens and buyers start buying from here then the next target could be 0.00003570.
What you guys think of this idea?

Bonk Done Bonkin'Traders,
As mentioned in my recent videos and posts, meme-coins (of all categories of coin) are looking positive here, especially those on the Solana blockchain. We’ve talked about Wif. We’ve talked about Boden (up 31% today). We’ve referenced TRUMP. All of these are on the Solana blockchain. All are doing well.
Another one I have referenced, stating it is in a good position for future boom is BONK. Up over 40% from its low, it continues to 🚀🚀🚀! Where will it go? My guess is the top of our green channel or that .00045 level. That’s an 82% increase from here. And look at that beautiful double-bottom pattern we have formed. How many times have we’ve been successful trading that pattern (rhetorical question)? It’s our best setup by far so far. So, if you are wanting to enter this trade, we could get another small pullback tomorrow through Thursday but that’s not a risk I’d be willing to take as the thing could just continue to the moon. My preference would be entry here, setting stops somewhere just below that channel, and then holding on tight.

Bonk breakout soon....Buy in parts , because BTC trading below 200ema in daily time frame, so once btc climb up above 60k then we can enter before that you can take a small entry

BONK surges 10%. Will the rally sustain?BONK’s price was bearish in the early hours of the day before support was established at the intra-day low of $0.00002. However, with the announcement of the treasury proposing an 84 billion token burn, the digital asset witnessed a 10% surge, reshaping investor sentiment and market trend.
This strategy is part of a broader effort to enhance token scarcity and increase its value over time. This can be considered as the turning point for BONK since decreasing the supply is usually positive for the investors. This burn according to the announcement represents the q2 amount of BONK sent to the DAO from BONKBot.
In April, the BONK Decentralized Autonomous Organization (DAO) had already set a precedent for such impactful decisions. The DAO passed a proposal to burn a staggering 278.39 trillion BONK, with the community vote showing overwhelming support: 418.63 trillion votes in favor, representing 99.9% approval.
The technical indicators on the BONKUSDT price chart point to continued bullish momentum. The Money Flow Index (MFI) rating of 68 suggests that money flows in the BONK market may sustain a bullish rally.
In addition, the Moving Average Convergence Divergence (MACD) has shifted into the positive region and above its signal line, reflecting a strengthening bullish trend. Moreover, the histogram developing higher bars suggests that buying pressure is increasing.
Concurrently, with a Relative Strength Index (RSI) rating of 67, this bullish momentum will likely trend upwards, with a potential target of $0.00003600 after hitting a double-bottom pattern on the 4-hour price chart.

Bonk Price Soars: Is Now the Perfect Time to Buy?BINANCE:BONKUSDT has demonstrated a notable upward trajectory in recent trading sessions. Recent closing prices have steadily increased from $0.00002396 to $0.00002643, showcasing a bullish trend. This upward momentum is supported by the 9 and 20 Exponential Moving Averages (EMA), which also indicate a positive trend. The 9 EMA has consistently stayed above the 20 EMA, further affirming the bullish sentiment in the market.
9 EMA values have climbed from $0.00002276 to $0.00002453, reflecting the increasing short-term momentum. Concurrently, the 20 EMA has risen from $0.00002248 to $0.00002352, indicating a strengthening longer-term trend. The Moving Average Convergence Divergence (MACD) indicator supports this bullish outlook, with the MACD line staying above the signal line. Histogram values have also increased, suggesting accelerating bullish momentum.
The Relative Strength Index (RSI) has moved into the overbought territory, climbing from 59.06 to 69.39. This high RSI level indicates that the asset might be overbought and could be due for a short-term pullback. However, the strong bullish indicators suggest that any pullback might be temporary.
In terms of potential movements, the Bonk price faces resistance at $0.00002664, $0.00002678, and a major resistance at $0.00002778. If the price can break through these levels, it may continue its upward trend. Conversely, support levels are observed at $0.00002604, $0.00002531, and $0.00002514. A break below these support levels could signal a shift to a bearish trend.
For traders considering entry and exit points, a potential long trade could be initiated if the price breaks above the $0.00002664 resistance, with a target towards $0.00002778. Stop-loss orders could be placed below the $0.00002604 support level to mitigate risk. For short traders, entering a position if the price falls below $0.00002604 with a target towards $0.00002514 could be considered. Stop-loss above the $0.00002664 resistance to manage potential losses can then be set.

BONG long setup📉 BUY: BONKUSDT
📌 Entry Point: 0.000022-0.000023
⛔️ Stop-Loss: 0.0000175
🎯 Take-Profit #1: 0.000028
🎯 Take-Profit #2: 0.000035
🎯 Take-Profit #3: 0.000047

BONKUSDTDO NOT FORGET USING A STOP LOSS
Warning:
This is just a suggestion and we do not guarantee profits. We advise you analyze the chart before opening any position.
I hope you are always profitable

BONK | Rinse and RepeatI think this might have been the bottom for BTC. If so, BONK will likely move to the upper range at least, and probably even make a new all-time high.

BONK priceIt is poised for an up move and likely to reach the $0.00003000 mark in the next sessions.

BONKUSDT 1D#BONK is moving inside an ascending channel. The RSI is showing bullish momentum. We expect it to continue its upward movement to the following targets:
$0.00003006
$0.00003429
$0.00004032
$0.00004800

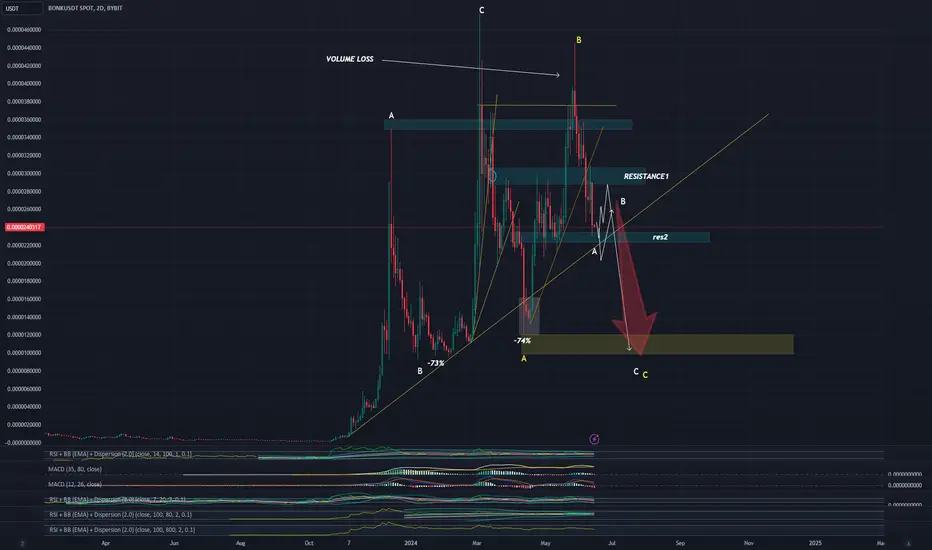
BONK PYRAMIDIt is about reading the price pattern and the result of the indicators
I will only share with you what the result of the analysis shows.
The weirdest coin to apply the abc strategy
This could be wrong. MD
$BONK - Bullish Structure DetectedBONK AI coin in Solana Ecosystem. As we know Solana have a great news and I think it will affects to all in the Solana ecosytem.
BONK have a bullish structure and still hold above the tren line.
Buy some in the purple area.
Target : $0.0000445 - $0.00006437 - $0.00010328 - $.....
Invalid if price close below $0.000018 on Daily

BONKUSDT - UniverseMetta - Analysis#BONKUSDT - UniverseMetta - Analysis
On D1, the price may push off from the lower border of the channel and begin an upward trend. From the border you can see a rebound of 30%, which indicates the presence of buyers.
On H4, for confirmation, you can wait for the formation of a 3-wave structure along the trend and consider buying. You should be careful if an ABC or 3-wave structure is formed, the price may make a false breakout and update the low again.
Target: 0.00002525 - 0.00003378
