BONK/USDT Technical Analysis (12h timeframe)This setup is based on a multi-factor method combining structure, RSI level, liquidity zones, and active narrative catalysts.
🧠 Method used:
• Identified a potential double bottom on strong historical support
• RSI < 40 on 12h TF → ideal zone for accumulation
• Price compression near key support levels
• BTC correlation checked (neutral to mildly bullish)
• Ongoing community narrative: BONK Arena (engagement + visibility)
🎯 Trade plan:
• Anticipated entry zone: 0.0000136 – 0.0000142
• Breakout confirmation: Above 0.0000150 with rising volume
• Stop-loss: 0.0000129
• TP1: 0.0000160 (+12%)
• TP2: 0.0000179 (+28%)
• TP3: 0.0000220 (+50%)
📌 Objective: short-term swing (1–2 weeks max)
Invalidation: close below 0.0000129 with confirmed volume.
Watching closely for a breakout trigger above 0.0000150.
BONKUST trade ideas

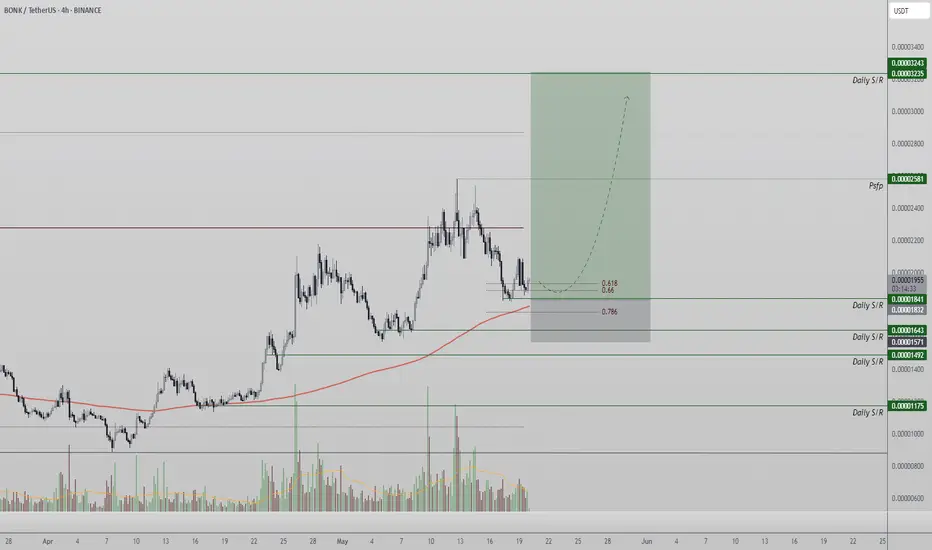
BONKUSDT | Long Setup – Fib Support + Price Action Scenario📈 BONKUSDT | Long Setup – Fib Support + Price Action Scenario
I usually avoid trading meme coins from the Solana ecosystem, but many SOL-based memes are currently sitting at technically significant support levels — and BONK is one of them.
🔹 Price has retraced into the 0.618 – 0.65 Fibonacci support zone, which historically has acted as a strong reversal area.
🔹 This region aligns with previous liquidity grabs and provides a solid foundation for a potential trend reversal.
🔹 A developing consolidation structure here supports a scenario where price may sweep local lows before a bullish break.
🟢 Projected move:
– Some accumulation at support
– Gradual structure shift with higher highs and higher lows
– Upside potential targeting 0.00001998
– Followed by a healthy pullback/retest
🎯 Target: 0.00001998
🛡️ Stop: 0.00001106
📈 Risk/Reward Ratio: Technically strong long setup
Despite it being a meme, I approach this trade purely from a technical perspective. Price action matters more than the narrative.
⚠️ This is not financial advice.
#BONK #MemeCoin #Solana #Altcoins #BONKUSDT #CryptoAnalysis #TradingView
BONK/USDTThis time, we reached a resistance area for this currency and I think this currency has the potential to be bullish. I have specified the target for you. Remember, this is an analysis, not an entry point. Tell me your opinion.

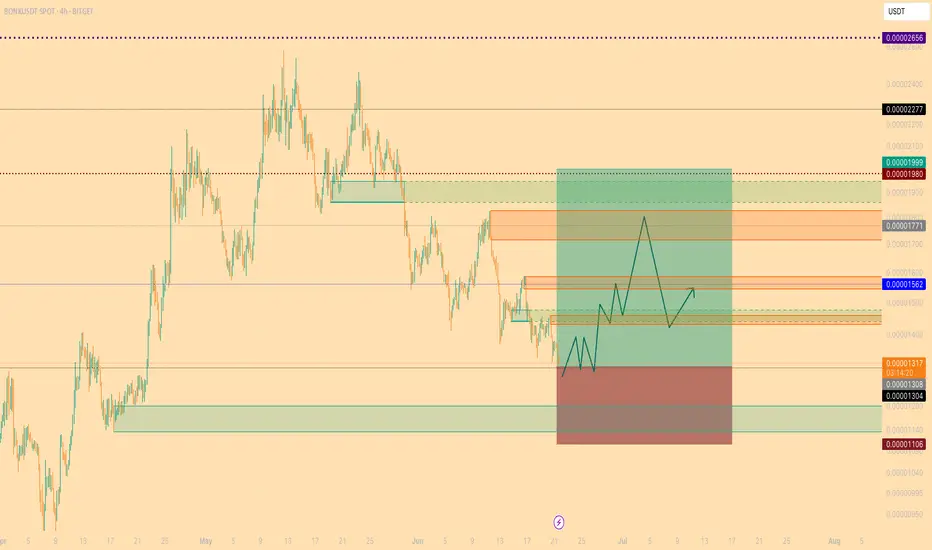
BONKUSDT Make A Falling Wedge Pattern In 4H Chart#BONK
Make a clean bullish Falling Wedge pattern on the 4H chart & Breakout It.Now We can Get a Long Position.
My profit Target
1 Target - $ 0.0001803
2 Target - $ 0.0001929
3 Target - $ 0.0002058
4 Target - $ 0.0002205
5 Target - $ 0.0002335

BONKUSDT 1D AnalysisBONK ~ 1D Analysis
#BONK Buy on retesting this support block or buy after successfully breaking this resistance line with a short term target of at least 15%+ and a long term target of $0.000065+

Short trade
🟥 Sell-side Trade Log
📉 Pair: BONK/USDT
🏷️ Type: Intraday | LND Session AM
🧠 Setup: Breakout
📅 Date: Sunday, 26th May 2025
🔹 Entry Price: 0.00001992
🔹 Profit Target: 0.00001908 (+4.22%)
🔹 Stop Loss: 0.00002007 (-0.75%)
🔹 Risk-Reward Ratio: 5.60
🔍 Reasoning:
This breakout trade was initiated after BONK/USDT failed to sustain its rally and formed a lower high structure. The price broke below a key intraday support zone during the LND AM session, signalling a shift in directional order flow.

BONKUSDT 1D#BONK is on the verge of a potential breakout above the descending resistance and the neckline of the Rounding Bottom Pattern on the daily chart. A successful breakout could trigger a strong bullish move.
Targets after breakout:
🎯 $0.00002640
🎯 $0.00003161
🎯 $0.00003682
🎯 $0.00004423
🎯 $0.00005368
⚠️ Use a tight stop-loss.

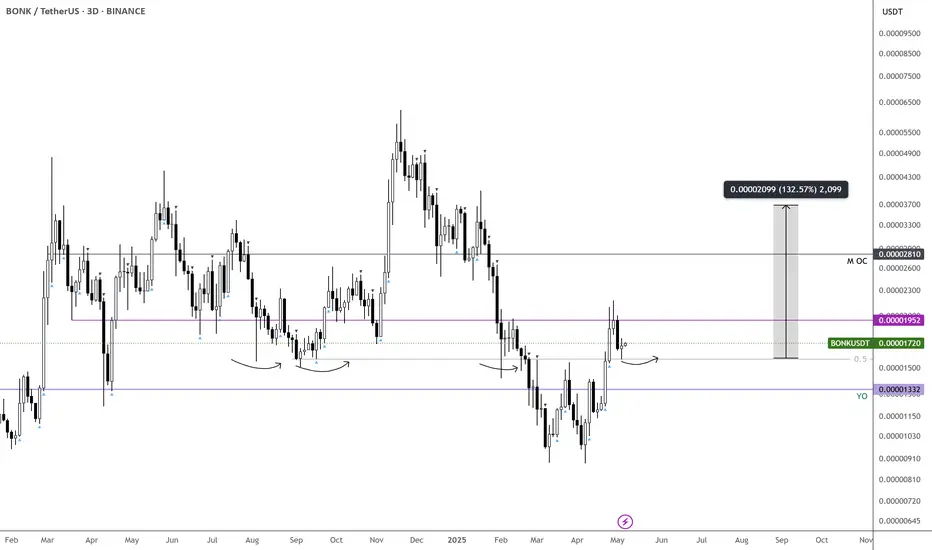
BONK/USDT: Bullish Market Structure with 77% Upside PotentialBONK is maintaining a strong bullish market structure, marked by a clear series of higher highs and higher lows on the chart. Price recently rejected from the point of control (POC) resistance, initiating a healthy pullback toward the 200 EMA — a common support level in uptrending markets.
This corrective move is currently finding strong support at a confluence zone that includes the 200 EMA, a key daily support level, and the 0.618 Fibonacci retracement. This level is acting as a high-probability support region, where price action is now forming a range and confirming accumulation on lower timeframes.
The establishment of this range suggests that demand is present, and buyers are stepping in to defend the trend. Importantly, the higher low being put in here would keep the bullish structure intact and signal a potential continuation towards new highs.
From a volume profile standpoint, each leg higher has been accompanied by increasing volume — a healthy sign for continuation. Bulls remain in control, and if price holds this level and breaks above the POC resistance on a closing basis, a move toward higher resistance levels becomes increasingly likely.
The upside target from this potential continuation is approximately a 77% gain, aligning with previous swing highs and projected Fibonacci extensions.
In summary, BONK remains bullish, with the current pullback offering a possible higher low setup. Watch for a confirmed breakout above the POC resistance — that will likely be the catalyst for the next impulsive move higher.
Long trade
🟩 Buyside Trade Log
📈 Pair: BONK/USDT
🏷️ Type: Intraday | LND Session AM
🧠 Setup: Breakout
📅 Date: Sunday, 18th May 2025
🕥 Time: 10:00 AM
🔹 Entry Price: 0.00001972
🔹 Profit Target: 0.00002159 (+9.48%)
🔹 Stop Loss: 0.00001924 (-2.43%)
🔹 Risk-Reward Ratio: 3.90
🔍 Reasoning:
The trade was initiated during the LND session AM window, where price action showed a clear breakout from short-term resistance. Momentum aligned with a surge in volume, suggesting strong buyside intent.

Buy Trade Strategy for BONK: Riding the Solana Meme Token WaveDescription:
This trading idea is based on BONK, a meme-based cryptocurrency launched on the Solana blockchain, gaining massive community support and attention for being Solana’s answer to Dogecoin and Shiba Inu. BONK stands out for its vibrant, decentralized community and deflationary tokenomics, which aim to encourage long-term holding and discourage excessive speculation. With strong grassroots momentum and integration across various Solana-based DeFi and NFT platforms, BONK has established itself as more than just a meme, becoming a symbol of community resilience and innovation within the Solana ecosystem.
However, despite its popularity, BONK remains a highly speculative asset. Meme coins are particularly sensitive to market sentiment, social media hype, and broader crypto trends. As such, price movements can be extremely volatile and unpredictable.
Disclaimer:
This trading idea is intended for educational purposes only and does not constitute financial advice. Cryptocurrencies like BONK carry high risk, including the potential for total capital loss. Always conduct thorough research, evaluate your risk tolerance, and consult a licensed financial advisor before investing. Past performance is not indicative of future results.

BONK looks ready to pivot—clear skies aheadLiking the price action so far. It’s flipped above the mid-level, which aligns with key pivots across multiple timeframes.
Ideally looking for a week of consolidation here before the next major move.
Entry around 0.0000158
Targeting 0.000028 if things unfold as expected
SEED_DONKEYDAN_MARKET_CAP:BONK BINANCE:BONKUSDT
#BONK/USDT#BONK
The price is moving within a descending channel on the 1-hour frame, adhering well to it, and is on its way to breaking it strongly upwards and retesting it.
We are seeing a bounce from the lower boundary of the descending channel. This support is at 0.00002070.
We have a downtrend on the RSI indicator that is about to break and retest, supporting the upward trend.
We are looking for stability above the 100 moving average.
Entry price: 0.00002205
First target: 0.00002287
Second target: 0.00002404
Third target: 0.00002551

BONK/USDT Bullish Analysis 🚀 BONK/USDT Bullish Analysis 🚀
📈 Key Bullish Factors: 🔹 📊 Fibonacci Levels: Price near 0️⃣ (0.0000885)—potential targets 0️⃣.382 (0.0001869) & 0️⃣.618 (0.0002961) 🔹 📈 Volume Spike: Increased trading activity = strong market demand 🔹 📉 Moving Averages: A breakout above 200-day MA confirms bullish trend 🔹 🔥 Candlestick Pattern: Strong bullish candles = High buying pressure
💡 Bullish Scenario: ✅ If 0.000035 resistance breaks → targets 0.00004 then 0.0000485 💥 ✅ If surpasses 🚀 0.0000485, next major milestone ✨ 0.0000623
🛡️ Support Levels: 🔸 Correction → Key support at 0.000022 💎 Hold = Bullish momentum continues
⚡ Momentum is building! Are we ready for liftoff? 🚀🌕💰

Bonk at Floor Price - 2x to 3x Pump Incoming?SEED_DONKEYDAN_MARKET_CAP:BONK has retested its 2024 floor price at $0.00001 - a zone that previously triggered strong upward moves. Could this be a reliable support once again and spark a 2x to 3x bounce from current market price at $0.00001135?
What's your take - bounce or breakdown from here?
Share your thoughts below!
Kindly support this idea with a LIKE👍 if you find it useful🥳
Happy Trading💰🥳🤗

$BONKUSDT back to ATH!!!Having broken a long term bearish trendline and a resistance zone as well. BINANCE:BONKUSDT has retested this resistance zone, turning it to support. It has turned bullish and fully ready to push back to its ATH and above.
Be on the look out and expect minor retracements while at it, as there are some support and resistance zones it can bounce off from. These zones are already marked out in the setup.
Kindly support this analysis to enable it reach to other people, and do comment your thoughts.

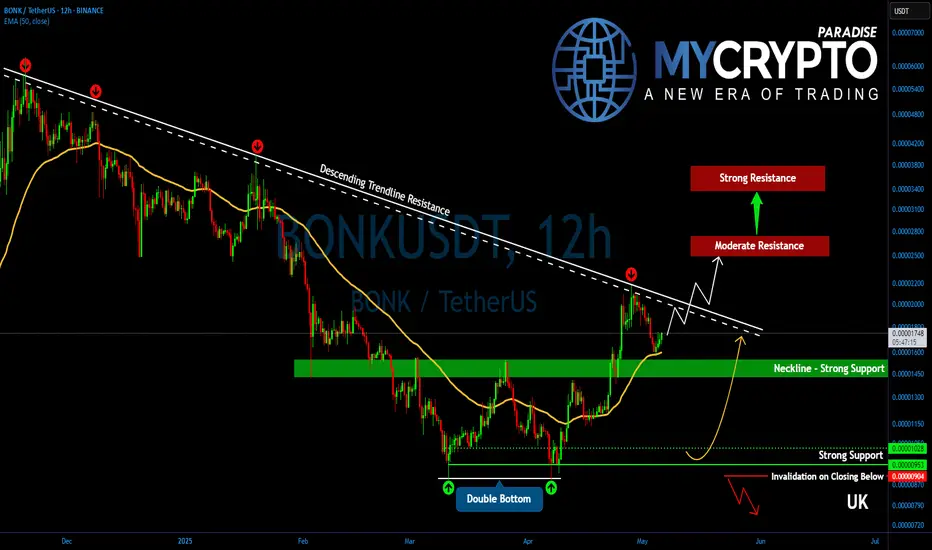
BONKUSDT Up for a Major Breakout! Key Levels to Watch!Yello, Paradisers! Is #BONK about to explode higher after weeks of consolidation? A powerful shift is underway—and the bulls might just be waking up at the perfect time.
💎#BONKUSDT is beginning to show a notable short-term trend reversal, with a double bottom pattern now confirmed. This structure signals a potential end to the recent bearish control, and price action is now pressing against the descending trendline resistance. A successful breakout here could completely flip market dynamics in favor of the bulls.
💎Following a minor round of profit-taking at the descending resistance, BONK pulled back toward the previous breakout support. That retracement brought the price right back into the key supportive range between 0.00001550 and 0.00001425, where it's now starting to bounce again. Notably, the EMA-50 has aligned perfectly with this support zone, adding strength to the reaction from this area.
💎BONKUSDT's next challenge lies at 0.00002000 to 0.00002100—a major descending resistance level that has capped upside since December 2024. Breaking above this structure would be a critical bullish breakout, potentially unleashing the next wave of upside momentum.
💎If bulls push through this barrier, BONK is expected to move toward the next moderate resistance at 0.00002500 to 0.00002750. This area aligns with the measured target of the double bottom formation. However, if bullish strength continues to build, BONK may even extend toward the strong resistance between 0.00003400 and 0.00003700, where the 50% Fibonacci retracement also resides—a historically significant level for potential trend reversals.
💎Adding to the bullish case, the 12-hour EMA-50 and EMA-200 are now converging toward a possible Golden Cross. If this cross confirms, it could serve as a major technical catalyst for a broader trend reversal and further upside continuation.
Paradisers, strive for consistency, not quick profits. Treat the market as a businessman, not as a gambler.
MyCryptoParadise
iFeel the success🌴

#BONK/USDT#BONK
The price is moving within a descending channel on the 1-hour frame and is expected to break and continue upward.
We have a trend to stabilize above the 100 moving average once again.
We have a downtrend on the RSI indicator that supports the upward move with a breakout.
We have a support area at the lower boundary of the channel at 0.00001825, which acts as strong support from which the price can rebound.
Entry price: 0.00001883
First target: 0.00001967
Second target: 0.00002078
Third target: 0.00002222

BONK ONCE AGAIN MAKING INTERESTING PATTERNSA 90% loss is a very real potential. A 500% gain is a very real potential. Breaking even is a very real potential.
To be clear, the only thing I'm recommending right now: Observe, Do Your Own Research, Keep an open mind, Be kind.
Stay Slick

$BONK here loks good for another 1000%SEED_DONKEYDAN_MARKET_CAP:BONK here looks good for another 1000%; cluster of htf levels with declining sell volume.
A run to ATH is 500%, and beyond to the fibs is over 1000%.
Easy invalidation just below pink yearly line.

Bonk targetsWe need to go and trade above 120, that ill open a first target to 190-200 and a second target to 250-260 zone. Overall Bonk looks very good now.

BONK Price Compression Signals Imminent ExpansionBONKUSDT continues to respect its ascending channel structure, recently bouncing from the immediate demand zone. We're eyeing a possible retest of the projected sell-off zone where the next big move will be defined. A bullish breakout here could ignite a rally toward the 0.00096906 mark, while rejection may drag price down to the strong demand zone at 0.00000365. All eyes on this key range—BONK’s next macro impulse is loading. Let’s see how it unfolds.

BONK ON TRONK OR BOUT TO FLONK? SEEMS BULLISH TO MEA lot of big time supports have been reached, and this little crypto has somehow survived. What is next?
I wouldn't be surprised if it went up by 20% or even 200%.
