to identify BPRs on Brent Oil FuturesI am not good at the ICT price action style. So I got 2 questions for traders that know this well.
1. Did i draw the correct BPRs? I use both bars and volume profile to filter FVGs
2. Do you only use BPRs to do after break trend following or position closing, or you can actually use them in resist
Contract highlights
Related commodities

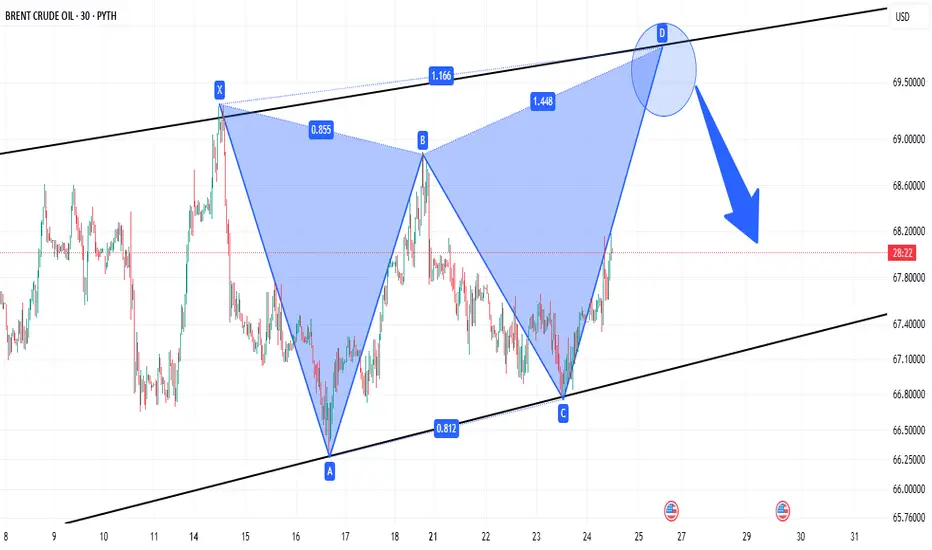
RANGING OIL PRICE HEADING FOR RESISTANCE.Price has been stuck in consolidation mode
Currently heading for resistance levels where we expect a decline
Backed-up by a bearish harmonic pattern
and a bear flag clearly visible on the 4HR time interval
Bearish Wolfewave in playPrice has entered below the 1-3 line.
Target is the 1-4 line.
Other targets are the intersecting lines which we call the magic line.
As long as at least the 4 hour SAR is above price - those target are in play.
Pattens can fail.
Do your own due diligence.

Bearish Wolfewave target madeWhat I like about this pattern is the nice risk/reward it has.
The ideal pattern has a drastic and large move that quickly happen.
I added Fibonacci time that intersects the 1-4 target line for alternative targets for scaling out.
This chart has multiple SAR from different timeframes to track pot

Bearish Wolfewave in playThis pattern is in play as long as at least the hourly SAR is above price.
The ideal target is the 1-4 line.
Scaling out at earlier targets increases the chances of taking a profit.
Patterns can fail.
Do your own due diligence.

Oil Prices Surge Following Armed Conflict Between Israel and Ira
In the early hours of Friday, June 13, a new turning point in global geopolitics emerged and extended through the weekend: Israel launched an aerial attack using missiles and drones on Iranian nuclear facilities, triggering an immediate reaction in energy markets. The conflict has continued through

OIL#OIL is showing signs of heading lower 📉
That’s a win for summer travel, home upgrades, and manufacturing before Q3.
Cheaper oil = lower inflation pressure ➡️ more $$ in consumers’ pockets.
Watch how this shift might boost spending and keep markets moving.
#Commodities #Economy #Inflation #SummerTra

Oil is Doomed: Time to SELL (Part 3/3)
Surplus + Bearish Forecasts = SELL
📊 Supply Up, Demand Down = Surplus
By mid-2025, the oil market will be in surplus .
Even conservative estimates show +500k barrels/day in excess supply.
🔮 Analysts Expect a Crash
- OPIS: “Could fall to $30–$40 if OPEC unwinds”
- Kpler: “Needs

Long Term Brent Outlook, $32 by 2026Weekly Brent has broken a clear barrier and formed a Bull Flag pattern, but the subsequent rally has been weak, not even reaching the breakout level.
The global economy is showing signs of weakening, leading to a reduction in oil demand. Concurrently, Trump's move to lift US production restriction

Brent crude: We maintain our USD 65 to USD 85 range for the yearBrent crude's current momentum has taken prices to a three-week high, with the latest move being supported by a combination of underinvested hedge funds, improved risk sentiment following a softening in the tone regarding tariffs after Trump indicated some nations could receive breaks from "reciproc

See all ideas
Displays a symbol's price movements over previous years to identify recurring trends.