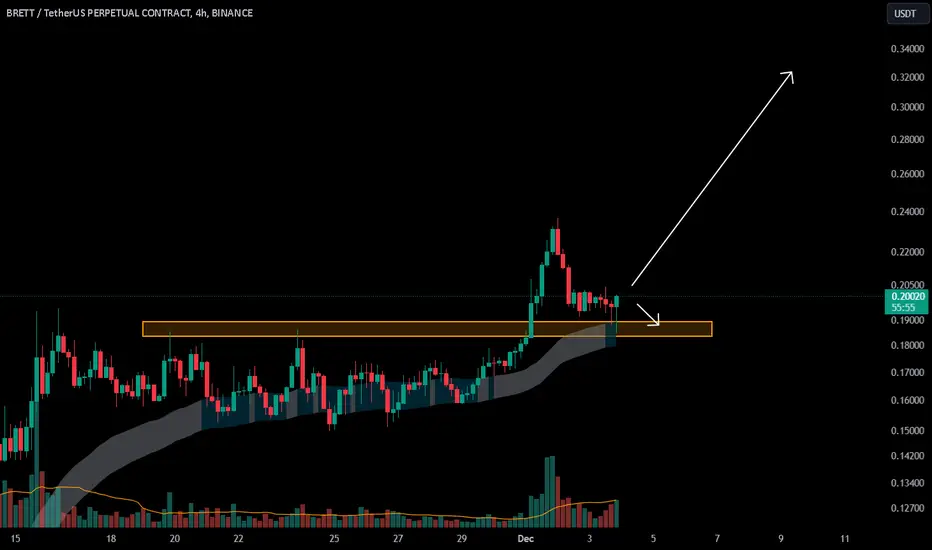
BRETT Long Spot Trade (Buying the Dip) Market Context:
BRETT's current price action suggests that any dip into the $0.18 zone represents a strong buying opportunity. The setup shows potential for significant upside, with favorable risk-to-reward dynamics.
Trade Setup:
Entry Zone: Around $0.18
Take Profit Targets:
First target: $0.30
Second target: $0.50
Third target: $0.75
Stop Loss: Daily close below $0.15
This trade aims to capitalize on the dip into support, targeting substantial price expansion in the upcoming trend.
BRETTUSDT trade ideas

BRETTUSDTKey Level Zone : 0.18358 - 0.18952
HMT v1.0 detected. The setup looks promising, supported by a previous upward/downward trend with increasing volume and momentum, presenting an excellent reward-to-risk opportunity.
HMT (High Momentum Trending):
HMT is based on trend, momentum, volume, and market structure across multiple timeframes. It highlights setups with strong potential for upward movement and higher rewards.
Whenever I spot a signal for my own trading, I’ll share it. Please note that conducting a comprehensive analysis on a single timeframe chart can be quite challenging and sometimes confusing. I appreciate your understanding of the effort involved.
If you find this signal/analysis meaningful, kindly like and share it.
Thank you for your support~
Sharing this with love!
Brett Update ( 1D ) one of best MEME in base network #BRETT with 2B $ MarketCAP Has Reached ATH may be able to target even higher peaks. Make sure to keep an eye on it!

How perfectWith 7-star you know when to long and when to short. Though indicators are not predictors but they are definitely a ray of hope in a dark tunnel. Though we have included lot of logic into that buy and sell prints, we still want you to look other aspects because it's very difficult to predict the market.
If BTC keeps going down then we can see the sell print will go to the place where it started.
DYOR
For indicator access, you can contact me.

$BRETTUSDT Strong Cup Handle formation over 6 monthsBYBIT:BRETTUSDT on Base chain is going to explode after 6 months of Cup Handle. It is not too late to fill your bags 🚀

BRETT breaking outBRETT 1day breaking out of the bullflag with the Alpha Thrust throwing green y'day indicates continuation We still need another candle to close outside to confirm RSI backs it in flashing bull Resistance at ATH 0.195 double top before this latest bullflag correction I think the momentum might crush this level but being so significant a level may have to retest it before the circus starts

$BRETT 100X LEVERAGED LONG
CONVICTION
This chart doesn’t “correct.” It doesn’t “consolidate.” It hunts. Every time some paper-handed clown tries to short, $BRETT casually steps on their neck and climbs higher. What’s that? You’re waiting for a pullback? Yeah, keep waiting—might as well sit by the phone for a text from your ex while you’re at it.
Fundamentals? Cope.
Oh, you need “fundamentals”? Here’s a fundamental for you: Price go up. That’s all you need to know. Stop pretending you’re Warren Buffett; you’re a degenerate gambling on internet monopoly money, same as the rest of us. Own it. $BRETT doesn’t care about “use cases” or “intrinsic value.” The only utility here is crushing shorts and making the poor seethe.
No Poors Allowed
Let’s be clear: If you’re reading this and thinking about “risk management,” you’re not built for this. This is a long-only zone, and the minimum entry fee is your dignity. If you’re not max-leveraged, your account balance better have at least three commas, or this party’s not for you. We’re here to win, not to “stay safe.”
Why $BRETT?
Because it’s $BRETT, that’s why. It’s inevitable. You don’t argue with gravity, and you don’t argue with $BRETT. Trying to fight this pump is like trying to fistfight a hurricane—except in this case, the hurricane is laughing at you while lighting a cigar with your liquidation notice.
Final Thoughts
Max out your longs. Take out a second mortgage. Sell your car. I don’t care what you have to do, but if you’re not riding this rocket, you’ll be watching the rest of us from the ground like the broke NPC you are. This isn’t financial advice; this is financial survival. Cope and seethe, no-coiner peasants. $BRETT to $1, and we’re not waiting for you.

$BRETT Can Easily Make 10x Before The End Of The YearChart is quite clear an obvious. $BRETT is in a trending channel that looks like a massive bull flag.
Its consolidating nicely and is going to find a new ATH.
IMO this meme coin will be as big as PEPE or DOGE. It can make an 80x if I am optimistic and a 10x if I am pessimistic.
What do you think?

BRETT - MEMECOIN PROTAGONIST OF THIS BULL RUN - TRADE PLAN + TAMarket Overview
Current Price: 0.15859 USDT
24h Price Change: -3.16%
Volume: 1.93M
The asset has shown significant volatility in recent weeks, with strong price movement followed by consolidation.
Technical Indicators
VMC Cipher B Divergences: The VMC Cipher shows divergence patterns that can help detect potential reversals or trend continuation signals. There are several key points where divergences are visible in the current chart. The negative divergence near the price top could indicate potential downside or correction
.
RSI (Relative Strength Index): Currently at 44.73. This suggests the asset is not yet oversold or overbought but is hovering near the neutral zone. A rise above 50 could indicate bullish momentum, while a drop below 40 could indicate bearish sentiment.
MFI (Money Flow Index): At 41.52, the Money Flow Index is also near neutral. A value above 50 would indicate positive money flow, suggesting that buyers are in control. Below 50 points to selling pressure.
Stochastic Oscillator: Currently at 57.71 for the %K line, and 35.74 for the %D line. This is considered neutral but nearing an overbought zone. A crossover from below 20 could be a buy signal, while crossing above 80 would suggest an overbought condition and potential reversal.
Volume Analysis
Volume Spikes: The recent volume spikes suggest high market activity, with strong buying and selling forces at play. The presence of a high volume near the price peak indicates strong interest, but it also raises the possibility of a correction or consolidation.
Price Action
The chart shows a bullish trend over the past period, with a strong price increase followed by consolidation around the 0.158 level. This sideways movement could be a pause before either a further bullish breakout or a pullback.
Support Levels: Around 0.15 to 0.16, with the current price testing the lower support level.
Resistance Levels: Around 0.18 to 0.19, which could be the next target if the bullish momentum resumes.
Technical Patterns
Consolidation Phase: The price is in a consolidation phase, which is typical after a significant upward movement. It might test support levels before making another move.
Divergence: The negative divergence in the indicators suggests that if price action fails to break through key resistance, a bearish correction might occur.
Sentiment Analysis
Given the current neutral signals from the RSI, MFI, and Stochastic Oscillator, market sentiment is indecisive. Traders should watch for breakouts or breakdowns from key levels to gauge the next move.
Trading Plan for BRETT (BRETT/USDT)
Bullish Scenario
Entry Point:
If price breaks and sustains above the 0.16 level, this could signal a bullish continuation. A close above 0.18 would be a confirmation of a potential upward trend towards 0.20.
Targets:
Short-term target: 0.18 (first resistance zone).
Medium-term target: 0.20 or higher if the bullish momentum continues.
Stop Loss:
Set a stop loss just below 0.15 (the recent support level) to manage risk in case of a pullback.
Bearish Scenario
Entry Point:
If the price drops below the 0.15 support level, this could signal a short-term bearish move. A sustained breakdown below 0.14 would suggest further downside potential.
Targets:
Immediate target: 0.12, which would be a key support level.
Stop Loss:
For a short position, set a stop loss above 0.16 to limit the risk in case of a trend reversal.
Sideways Consolidation
Strategy:
If the price continues to move sideways, trade within the range by buying near the 0.15-0.16 support zone and selling near 0.18-0.19 resistance. This strategy would rely on short-term price movements and volatility.
Risk Management:
Always set stop losses just outside of support or resistance zones (around 0.14 for support and 0.20 for resistance).
Watch closely for breakout or breakdown signals above 0.16 or below 0.15.
Given the current neutral indicators, it’s wise to be patient and look for confirmation before entering large positions.
Maintain good risk management strategies, such as using tight stop losses and adjusting position size according to market conditions.
This plan takes into account both technical indicators and price action, but always stay updated with market news that may influence price movements.

Alikze »» BRETT | Ascending Channel - 1W🔍 Technical analysis: Ascending Channel - 1W
📣 COINEX:BRETTUSDT It is moving in an ascending channel on the weekly time frame.
🟢 It has had several positive reactions with demand at the bottom of the ascending channel.
🟢 Given the current momentum that is in the supply area and the middle of the ascending channel.
💎 If the current area is broken, it can grow to the 0.41 area.
⚠️ Given the recent zigzag correction at the bottom of the channel, it has encountered buying pressure candles that can be considered the LVL Invalidation range as invalidating the bullish trend analysis. ⚠️
»»»«««»»»«««»»»«««
Please support this idea 💡 with a LIKE 👍 and COMMENT 💬 if you find it useful and Click "Follow" on our profile if you'd like these trade ideas delivered straight to your email 📧 in the future.
🙏Thanks for your continued support.
Best Regards,❤️
Alikze.
»»»«««»»»«««»»»«««

#brett 4hIn the 4-hour timeframe, this cryptocurrency can be examined in the medium term with specified stop-loss and targets.

Just for me - Small trade in Brett BasedJust for fun. Saw their whitepaper, looks fun.
Hope it's gonna be the next shib or doge. Has a big fanbase.

BRETT - all time high and moon soon!?Brett - funny meme coin that retail likes to gamble on.
Brett is near all time high and a huge explosion is possible. If you don't already have a Brett position, it may be time to prepare for one. I see a pull back to 0.14 as healthy and a good entry before Brett picks up new power. Right now Retail is rushing into the market and it is not certain that there will be a pull back to the 0.5 fib level.
BRETT is risky with high volatility but with great potential.

BRETT/USDT NEW ATH EXPECTINGBRETT can show a new increase trend in the coming time.
There is a possibility for a new ATH in the coming period.

BRETT/USDTThe weekly chart for BRETT/USDT shows a potential bullish reversal as the price breaks out of a descending trendline. Currently, the price is at $0.11613, up 13.07%, indicating a possible shift in momentum.
Key Targets:
Target 1: $0.16776 – first resistance level with a potential gain of 154.22%.
Target 2: $0.27654 – extended target if bullish momentum strengthens.

BRETT on Base breaking outBRETT 1day on base #1 Meme is breaking out of the long-term downward trendline RSI flipping bullish MACD flipping bullish and pretty much blue sky back to ATH 6 months ago around 0.20 From there it's price discovery in what could be the most explosive bull market ever Current MC is 1.25Bln with around 600k holders and Coinbase onboarding retail investors the upside potential is massive Stay based

Meme Magic on BRETT: Don’t Miss This Bullish Trend!THIS IS A MUST BUY! 🚀 As most memes are currently flipping bullish, this one just fired a bullish signal right off the lows.
What’s to like? This is just the beginning of the weekly trend. Sure, it might seem a bit late, but if everything aligns, the swing is safe to take.
I can’t see a chart more bullish than this at weekly prices. Price targets are indicated by the boxes, so adjust your risk and go long now! 📈
Grab It Now, Cash In by November!💰📈

BRETT - POTENTIAL REBOUND - TECHNICAL ANALYSIS + TRADE PLANTrend Analysis:
The price is in a downtrend on the 4-hour timeframe, with lower highs and lower lows.
Recent candles show consolidation near the $0.07500–$0.07800 range, possibly signaling that sellers are taking profits, leading to some temporary support.
Volume Analysis:
The trading volume at 7.722M shows notable interest in BRETT, but it has not increased significantly to suggest a reversal.
Decreasing volume in a downtrend typically signals a potential for consolidation or a short-term reversal as selling pressure may weaken.
Momentum Indicators:
VMC Cipher B: The VMC Cipher B indicator shows mixed signals with green dots indicating potential bullish divergence, which could mean an upcoming price increase. However, the current momentum on VMC suggests a weak upward push, not strong enough to confirm a trend change.
RSI: At 36.55, the RSI is nearing oversold levels, suggesting the possibility of a short-term rebound but not necessarily a strong reversal. RSI has room to drop further before signaling a strong buying opportunity.
Stochastic: The stochastic oscillator shows an upward cross around 52.72, suggesting a potential buy signal. If the momentum continues, there may be a short-term move to the upside.
HMA-Hist (Hull Moving Average): This histogram shows mixed trends with no definitive sign of strong bullish or bearish pressure, indicating that the trend could go either way in the short term.
Key Support and Resistance Levels:
Support: The $0.07500 level is acting as the immediate support. A breakdown below this level could signal further downside.
Resistance: The $0.08500 and $0.09000 levels are nearby resistance points. If price breaks above these, it could confirm a trend reversal.
Trading Plan
Entry Strategy:
Short-Term Long Position: If the price holds above $0.07500 and RSI remains oversold, consider a short-term long entry with a target near $0.08500. Enter only if there is confirmation from both the RSI and Stochastic crossing upwards.
Breakout Long Position: If the price breaks above $0.08500 with high volume, consider a long position, as it may signal a bullish reversal. Look for further confirmation from the VMC Cipher B and a continued upward trend on Stochastic.
Stop Loss:
Place a stop loss below $0.07300 for long positions to limit potential losses if the price breaks the current support.
Target Levels:
Take Profit (TP) 1: $0.08500 – This is the immediate resistance level. Take partial profit here if the price approaches this level.
Take Profit (TP) 2: $0.09000 – If the price sustains above $0.08500, consider holding until $0.09000 for additional profit.
Risk Management:
Risk-Reward Ratio: Aim for a minimum 2:1 risk-reward ratio by adjusting entry points and take profit levels.
Position Sizing: Limit exposure to a small percentage of the portfolio to manage volatility and avoid significant losses in case the price continues to drop.
Monitoring:
Continuously monitor the volume and momentum indicators (RSI, Stochastic) for any changes that could signal a continuation or reversal of the current trend.
Be cautious of market-wide trends and news that could impact overall crypto market sentiment, as this could affect BRETT’s price movement.

BRETT ANALYSIS🚀#BRETT Analysis : Pattern Formation
🔮As we can see in the chart of #BRETT that there is a formation of Inverse Head And Shoulder Pattern and it's a bullish pattern. Also we can see a breakout here. Around 20-40% bullish move is pending in #BRETT
🔰Current Price: $0.10990
🎯 Target Price: $0.1330
⚡️What to do ?
👀Keep an eye on #BRETT price action. We can trade according to the chart and make some profits⚡️⚡️
#BRETT #Cryptocurrency #TechnicalAnalysis #DYOR

$BRETT from 0.9137 to 0.1516Long
The coin is approaching the activation zone for the third time, which will automatically lead to its breakout. However, there might be a pullback to the 0.93 zone in order to complete the Hall Correction Level on lower timeframes, and only after that, it will move towards 0.15.

BRETT Long Spot Position (Key Zone Test)Market Context: BRETT is displaying minor higher lows but hasn't confirmed significant higher highs yet. As the price approaches the $0.07 level, it enters a critical zone where market makers could potentially sweep the lows and form a double bottom, offering a strong risk-to-reward setup.
Trade Setup:
Entry: Around the $0.07 area.
Take Profit:
First target: $0.11
Second target: $0.14
Third target: $0.17
Stop Loss: Daily close below $0.05.
This trade offers a favourable risk-to-reward ratio as we aim to capitalize on the potential double bottom formation. #BRETT #Crypto

BRETTUSDT - Possible Buy Opportunity on BRETTBrett is a community based meme token. Brett aims to leverage the power of such an iconic meme to become the most memeable ...
Brett (BRETT) is a memecoin and the official mascot of the Base Chain, inspired by the character Brett from Matt Furie's Boys' Club comic series.
Looking at the RSI on the 1-hour, 1-day and 1-week intervals they are all at the bottom of the range with allot of up-side potential. Apart from the small correction on the 1-hour chart, BRETT is already at support and allows for a buy opportunity at these levels.

BRETTUSDT.P A Potential Bullish Setup!!BRETTUSDT.P chart is showing a potentially bullish pattern on the daily timeframe, around the 61.8% Fibonacci retracement level and a long-term trendline originating from May 14, 2024.
BTCUSDT.P has been retesting the 200-day EMA for three consecutive days, indicating a zone of high interest.
Important Note: This analysis is based on a candle that has not yet closed. It’s crucial to wait for confirmation with a full daily candle close above the trendline and Fibonacci level before considering a trade and sometimes even wait for double retest.
This idea adds clarity that the analysis is anticipatory, giving traders a heads-up on a potential setup.
