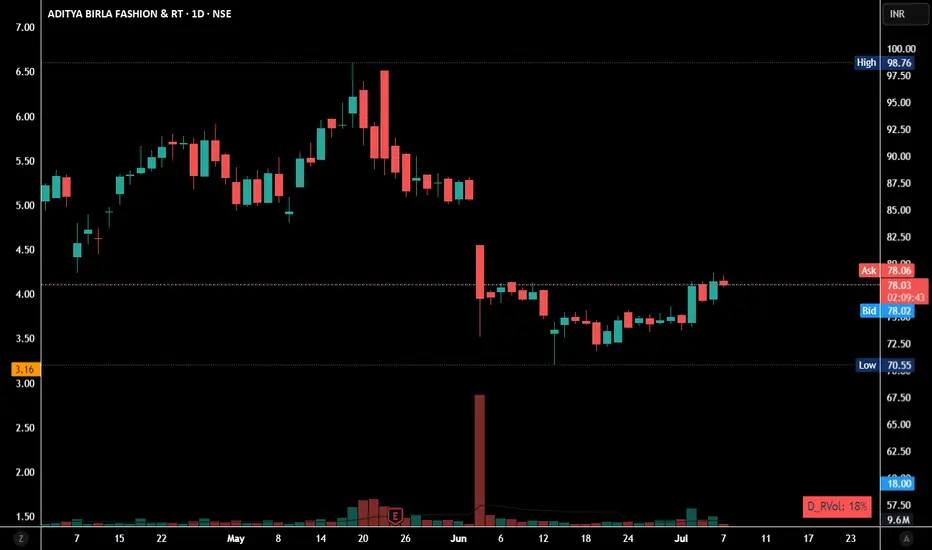
Rising Institutional Buying
Rising Institutional buying has been seen in this stock. This quarter is full of their accumulation it seems. It'll be interesting to see whether it holds 80-90 level.
Chart is for educational purpose, not a Buy/Sell Reco.
ABFRL trade ideas
ABRL short term long 98 on the way LONG term also goodABRL
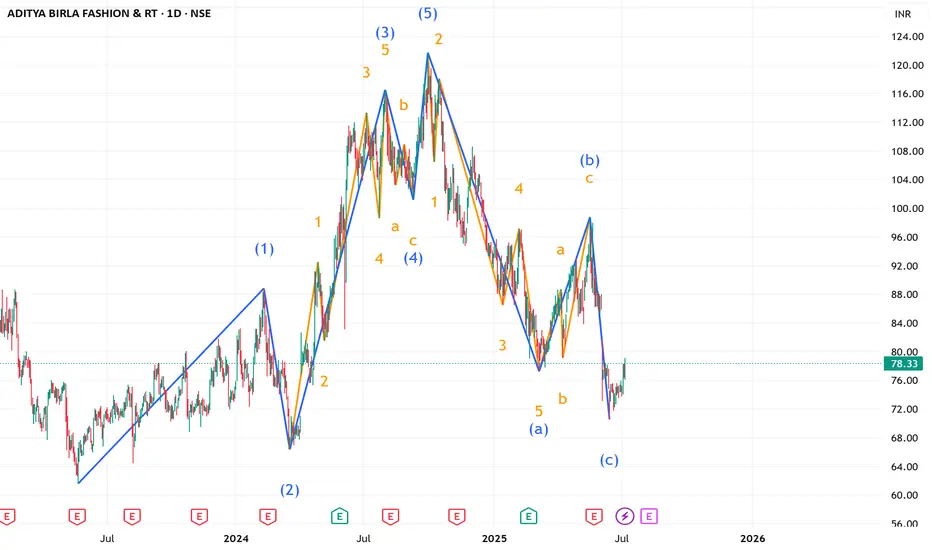
looking good structure as per daily counts
seems correction zigzag done ABC
in validation level 69.90 on daily
only for education chart
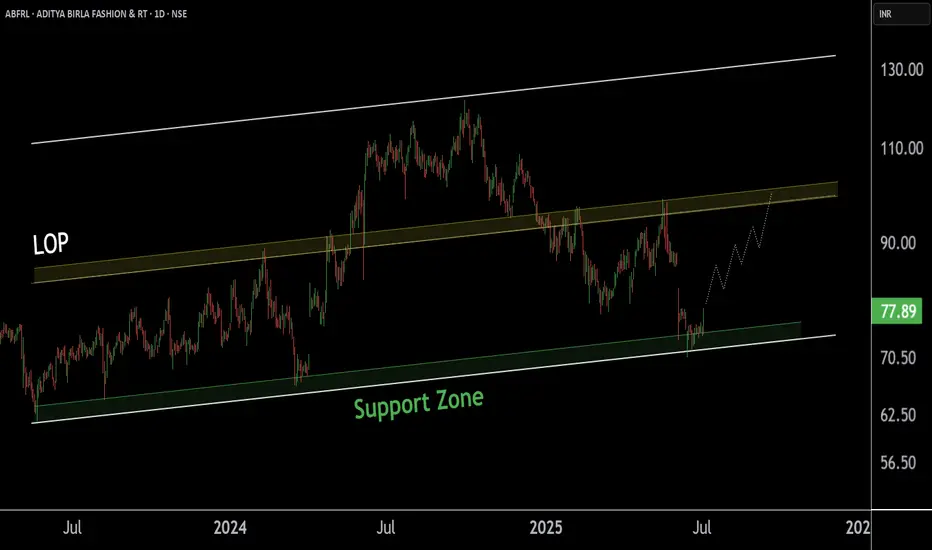
ABFRL at Best Support !!This is daily chart of ABFRL.
ABFRL having a good support zone near at 70.
ABFRL's last observed point (LOP) is near ₹100, which may now act as a resistance level.
ThanK You !!
Aditya Birla Fashion BuyAditya Birla Fashion break above channel resistance. Buy @CMP (78) with SL of 73 and target of 81, 86 & 105

ABFRL at Best Support !!This is the Weekly Chart Of ABFRL .
ABFRL having good Law of Polarity at 70 range.
ABFRL having EMA support at 72 range
If this level is sustain , we may see higher price in ABFRL ||
Based on time-wise analysis, our initial expected return is 40–42%, which the stock consistently forms beyond the Law of Polarity (LOP).
Thank You !!

ABFRLIs the financial engineering dead ?
Have a look at most of the demergers, they are short term euphoria.
ABFRL is no less. The Consultants take their million dollar fees for their MBA jargon / useless and non practical solutions and billions of dollars of losses for the shareholders.
Technically ABFRL could have a bounce back at Rs 77 but could consolidate here for a few months before trying to ascend.

ABFRL Spotted on SuppotABFRL's chart is showing a lot of positive signs.
On the monthly timeframe (linear chart), the stock has been taking support from levels dating back to 2020. There's also support from one of the key EMAs, and the Volume Profile suggests accumulation in this zone.
To add to that, the monthly RSI is also holding at a strong support level.

ABFRL , 1D Looking Very good pattern and ready for Breakout and Nifty is also Showing Bullishness , So Breakout will be very Clear and Good
Take Entry after the break of upper trendline and risk according to your risk taking capacity
in Expansion Channel this is channel Pattern and Breakout in 1D time Frame .
just risk 3-4 % of your allocation and Aim for 30% Maximum . You can book partial profits if it goes above 15% .
if it closes below the down trendline , you must be not in the trade
This is Just my point of View only
Follow for More Swing Trade Ideas

ABFRLABFRL wave analysis shows we are @ end of a leg correction to complete anytime this month. the next leg up could be an X up and fall on Y else this could be a running flat where the correction ends here and wave 3 starts. note as per the theory we are not supposed to consider a running flat until we see a clear impulse, hence both options are left open which shows the trend direction is about to change. always protecting the capital is the first target.

Aditya Birla FashioMcap: Rs 30,000 cr
Losses as Capex still growing
Rumours of splitting the company.
Technically, in a downturn but has posted 26% for the year and outperformed Nifty.
Target 190 !!
timeline: Mid May 25.

ADITYA BIRLA CAPITAL MY NEW STOCK FOR 2 MONTHSAdity birla capital now on support ...We can expect 20 to 30% upside move... It's holding time ll be 1 to 2 months only..We are not sebi registered..If you want to earn money from stock market.. First you learn in a proper way

ADITYA BIRLA CAPITALAdity birla capital now at support...We can see 20 to 25 % rally.. It's holding time ll be 2 to 3 months..We are not sebi registered..If you want to earn money from market.. First you learn properly...My stock only for learning purpose

ABFRL Near Resistance – Awaiting Bullish Breakout!➡️ Awaiting breakout above ₹353.95
➡️ Strong ascending trend line support in place
➡️ Strong Volume
➡️ Next targets: ₹380 on upside

Darvas Box Strategy - Break out Stock - Swing TradeDisclaimer: I am Not SEBI Registered adviser, please take advise from your financial adviser before investing in any stocks. Idea here shared is for education purpose only.
Stock has given break out. Buy above high. Keep this stock in watch list.
Buy above the High and do not forget to keep stop loss, best suitable for swing trading.
Target and Stop loss Shown on Chart. Risk to Reward Ratio/ Target Ratio 1:2 & 1:3
Stop loss can be Trail when it make new box / Swing.
Be Discipline, because discipline is the key to Success in Stock Market.
Trade what you See Not what you Think .

ADITYA BIRLA FASHION (ABFRL) Time to dive for a swing
ADITYA BIRLA FASHION (ABFRL) is trading near its 52 week high & consolidated for few weeks and trying to break resistance, once it breaks and sustain above resistance price will move towards 500INR.
This is just my overview on the basis of price action and i am not recommending to buy or sell.
(I am not SEBI registered)

ABFRLADITYA BIRLA FASHION has 2 years resistance level breakout with good consolidation and this stock upto 45% upside TGT and this is just for educational purpose only

Aditya Birla Fashion Nearing Bullish Breakout Zone!
➡️ Bullish breakout above ₹326, with next resistance at ₹349.15

ABFRL Bullish FlagBullish Flag Pattern in ABFRL
The daily chart of ABFRL is showing a Bullish Flag pattern, which is a continuation pattern that suggests the stock is likely to continue its uptrend. The pattern is characterized by a sharp rise in price (the flagpole) followed by a consolidation phase (the flag) where the price trades within a narrow range.

READY FOR ROUNDING BOTTOM BRRAKOUT...NSE:ABFRL trade at 325 level. Stock chart shows that its make a Rounding Bottom pattern on weekly time frame and ready for give a breakout. So You can watch for an Upside Move at 400-450 level...

ABFRL Aditya Birla Fashion upside target 330, 350Aditya Birla Fashion's stock can see a good uptrend, the stock can see targets of up to 330, 350 in a short period. The stock also saw an increase of about two and a half percent in today's session. A bullish engulfing in stock
The candlestick pattern has been seen with the stock closing with a bullish hammer candle on the one-hour chart, the stock gap may open in tomorrow's session. Also, the number of buyers in the stock today was 10 times that of the seller, indicating a gap up for tomorrow. Please take the help of your financial advisor before making any investment. We only present trending stocks with bullish or bearish reasons.

ABFRL - Cup & Handle - WeeklyA Weekly close abv 285 would trigger the Cup & Handle breakout to catch up momentum for a ride to 350

ADITY BIRLA FASHION BRAKEOUT IN 3 PATTERNS NSE:ABFRL
ADITY BIRLA FASHION BRAKEOUT IN 3 PATTERNS
buy Near 290
SL 250
Target 340, 405+
Time duration 1 month

ABFRL -Stage AnalysisABFRL -Stage Analysis
Stage 2 Started
52 Wk High 300
Huge volume in last couple of weeks
Big candle with high volume
05-Sept-23
Above 50/150/200 DMA After 30 Days
(from 200 EMA Crossed Below)
28-MAY-24
1. Above 50/150&200 DMA
2. 150 ABOVE 200 & 50 ABOVE 150
3. HH\LL
