ABFRL Buy above Rs. 225ABFRL Buy on Closing basis only, the price has reversed from the demand zone with rising volume.
Please give a boost if you like the analysis and follow for more. Any suggestions or advice is humbly welcomed.
Disclaimer:I am not a SEBI Registered Analyst, and the views expressed here are solely my own and for educational purposes only. Make sure you consult your Financial advisor before investing, as I won't be responsible for any losses incurred.
ABFRL trade ideas

ABFRL DAILY CHARTABFRL on its daily chart is oversold & @ 3.61 extension possible bottom is in place.
So qualifies for a contra BUY.
Only an observation & not suggestion

ABFRL_14.07.2023Fast towards 226. Big breakout/breakdown expected at 226. Keep an eye. For educational purpose only.

#ABFRL. 11/07/23#ABFRL...
Intraday as well as swing trade
All levels given in charts ...
IF good potential seen then we work in options also
if activate then possible a good movement Keep eye on this ...
We take trade only when it activates...
Possible to give good target
TRADING FACTS

ABFRL ViewsThis script recently is indicating the formation of value area based on price volume patterns.
It will be worth watching it for study purpose.

ABFRL - Bullish Momentum with VolumesNSE: ABFRL is closing with a bullish momentum candle supported with volumes.
Today's volumes and candlestick formation indicates strong demand and stock should move to previous swing highs in the coming days.
The stock has been moving along the horizontal support for the past few days which is indicating demand.
One can look for a 8% to 12% gain on deployed capital in this swing trade.
The view is to be discarded in the event of the stock breaking previous swing low.
#NSEindia #Trading #StockMarketindia #Tradingview #SwingTrade


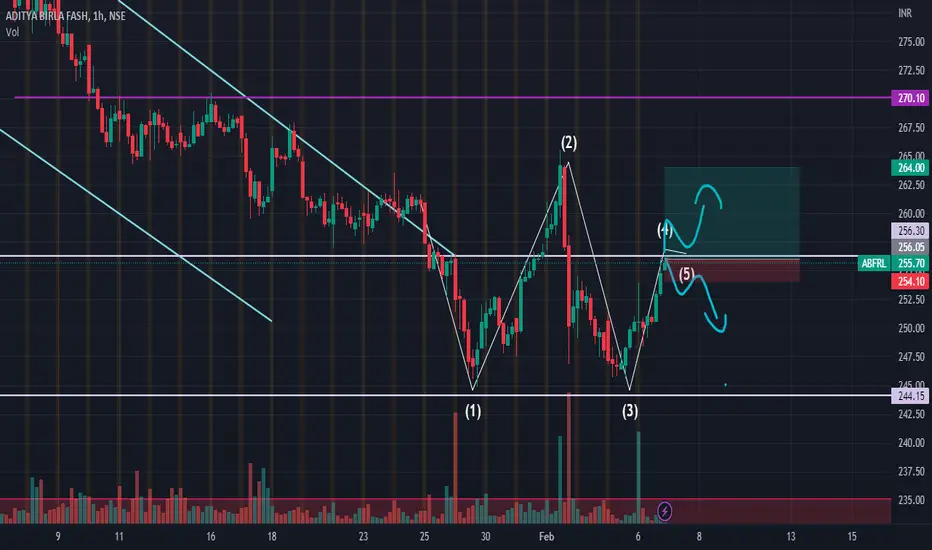
ABFRL POSSIBLE WAVE COUNTS - ADITYA BIRLA FASHION AND RETAILHello Friends,
Today I am sharing my view on Aditya Birla Fashion And Retail Limited.
ABFRL is now ready for new long positions as per Elliot Wave structure.
It is suppose to complete WAVE ABC as Expanded Flat Correction which usually comes in 3-3-5 waves.
Now price is in 5th wave of corrective wave ABC which any time get reversal from downtrend to uptrend.
MACD showing strength as price is making lower low but macd makiing higher low
similar Scenario with RSI
confirmation of reversal
One can make new long positions in ABFRL after the breakout of wedge pattern.
Disclaimer
I am not SEBI registered analyst.
all the studies are for educational purposes.
I am not responsible for any kind of your profits and losses.

Ab fashion in my buying radarWILL BUY ABOVE 227 for target of 240 minimum for a short term trade like 10/ 15 days max this is under my radar now will execute as the reversal gets confirmed above 227

ABFRL Breaking Downward Sloping ChannelABFRL is breaking a long downward sloping channel on Daily Time frame.

Aditya Birla Fashion & Retail Ltd - 13.04.2023Aditya Birla Fashion & Retail Ltd - 13.04.2023
The stock price is above EMA in Daily Chart.
There is a MACD Bullish Divergence in Weekly Chart.
There is a Stochastic Bullish Divergence in Weekly Chart.
The stock can be considered for further upside movement with SUPPORT @ 218
A probable trend reversal candidate.
Watch out for the price action.
DISCLAIMER: This is not a Stock Recommendation.

BuyThis channel is about sharing my views about the Indian stock market. I am not SEBI registered. This channel is only for educational purposes. Before taking a trade takes a suggestion with your Financial Advisor (or) Trade at your own risk. I am not holding any position.
ABFRL is looking a very good position to buy with the T1 - 239 , T2 - 262

ABFRL AT CIP LEVEL +DEMAND ZONE !!Hello to everyone
The price trading near weekly demand zone . A significant decline has been seen in the price and the price is now trading near the demand zone . so the price can takes rest from the decline and can move upwards from the support zone .
If the price respects the support zone and if any bullish candle or formation is formed then we can build our position to the upside.
#ABFRL
👉Do Or Die level
👉Support seen at 222-220
👉Reversal sign
👉If holds then its can move for 260/280/300
👉Add to your watchlist
Traders, if you liked this idea or if you have your own opinion about it, write in the comments. I will be glad.

ABFRL BULLISH MOMENTUM VIEW!!!!The price persisted itself at the strong support level 235-- 242 & also respected the trendline support. In daily chart price also forms the base for upside move in coming days.
Here the price & chart indicates perfect low risk & high reward setup. We can enter in long position with the SL of below the support level for swing trade.
👉🏻Strong trendline support✅
👉🏻RSI divergence✅
👉🏻Reversal Candle📈
👉🏻Support at 240-35👍
👉🏻Low risk high reward setup.✅
👉🏻Keep stock on radar for swing trade.👍


ABFRL I HAVE FOUND DOUBLE BOTTOM PATTERNBe ready for it bullish breakout of nick line on chat i have mark level on chart
ABFRLHello, my dear friends and fellow traders. What we are going to look at today is the ABFRL stock.
This analysis is based on weekly chart. This stock gains support level and breaks the previous resistance level and makes all-time high. There are opportunities to go upside because this support level has been carried the price once again to all-time high
Thanks & regards,
Alpha Trading Station
Disclaimer: This view is for educational purpose only & any stock mentioned here should not be taken as a trading/investing advice. We may or may not have position in the stocks mentioned here. Please consult your financial advisor before investing. Because Price is the "King of Market".

ABFRL : Breakout Canddidate#ABFRL very close to a range Breakout
Stock gaining Strength & Volumes building up.
Another Wedding/Festive & Holiday Season Theme Stock
Take 5-10% & Keep Trailling
Keep Sharing, loving & following for more Learning.
Happy Trading !!!

ABFRL LONG TRADE (INTRADAY DEC 15)Hello TradingView community and my followers, please if you like the ideas, don't forget to support them with likes and comments, thank you very much and here we go.
.
ABFRL
Daily : Stock is in uptrend.
15 min : It has broken pennant and has currently made falling wedge.
*Wait for the breakout and we could see an upside movement.
THANK YOU !!!!

ABFRL buy for intraday tradingABFRL buy for intraday trading if stock break the given resistance level..........


Positional Buy on ABFRLBest buy level of NSE:ABFRL is 308 with Stop loss of 298. We can expect targets of 314, 322 & 328 within 2-3 weeks.
Note: This is my personal analysis, only for learning. Thanks.
