abfrlabfrl looks very much in ascending range and shows a continuous interest of buyers and insider in it . for investor can give up to 50% return in coming one year.
ABFRL trade ideas

ABFRL - Ascending Triangle - Very low Risk High Reward tradeThe above analysis is done purely on basis of Price Action & Chart Patterns.
The analysis is done on daily TF hence price may take few days to few weeks in order to reach the targets.
Trade setup is explained in image itself. Entry should be above the high of today's candle
The above analysis is purely for educational purpose. Traders must do their own study before entering into any trade. Traders must trade as per their own risk taking capacity and money management.
Checkout my other ideas to understand how one can earn from stock markets with simple trade setups. Feel Free to connect with me for any query or suggestion regarding this stock or Price Action Analysis.

Abfrl aditya birla fashionOn Trendline support.
Best entry here.
Minimum sl under the trendline.
Sl 190 Daily candle closing basis sl.
Target 230.
RR ratio 1:3

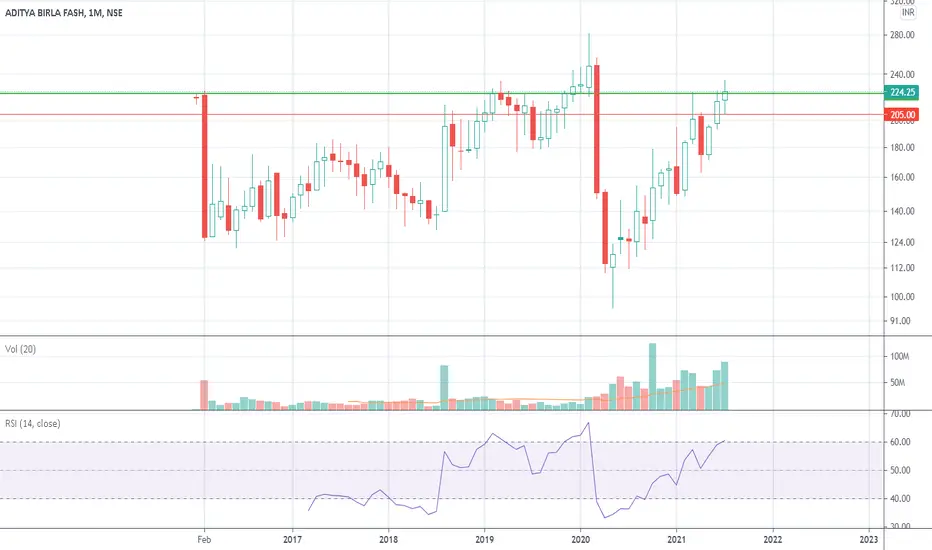
ABFRL - Will it or Will it NotABFRL - Close to Breaking barriers. Will it cross the 225 barrier and then the 250. Has made several attempts in the past but has not sustained above it. Let us see.
DISCL NOT A SEBI REGD. I post charts for my own study.

watch fo rangre breakout in ABFRL 1. horizontal resistance breakout
2. volume breakout
3. RSI around 70 with upwards direction
4. buy above 222 on closing basis for swing trade for 8-10 percent

Aditya Birla Fashion looks bullish.After a single day massive fall ABFRL rebounded by touching 55 day ema. This comes after breakthrough from a decisive last swing high. The stock is backed with huge deliveries on upward movements and low deliveries at downward. Time to accumulate after each fall for mid to long term swings.

ABFRL - C&H pattern breakoutSL & Target as per chart.
Breakout has been seen with very good volume.
Good thing is there is no previous resistance on the way to it's technical target.
Also technical target is also somewhat of its previous resistance.
Good to go long.

ABFRL Breakout1. Very aggressive longs added in futures
2. Daily and weekly break out with volumes
3. Taking very good support at 21 EMA

ABFRL [Intraday] Short BetSell if breaks the candle low
Note :-
Entry - At the break of mentioned candle's low/high
Stop Loss -
In a Short Trade, I always use Previous Candle High ( PCH ) as a stop loss while entering the trade. Sometime I might use smaller tf SL & trade in 15M or 30M tf which I'll mention. Vice Versa for long trades
Trailing Stop Loss ( TSL ) - Mostly I trail stop loss by PCH as price falls . I exit as PCH breaks & vice versa
Use of PSAR indicator as TSL :- TSL get's hit in trend following due to noise, In such cases I use PSAR to be in trend & exit if PSAR direction change ( PSAR : Parabolic Stop n reverse )
You can use any one of above mentioned or your own way to manage risk
Time Frame :- I take ~ 90% of my intraday trades in 15m tf. Where my analysis might come from higher frames like W , D or 1hr chart pattern which will be mentioned.
Target :- I do set target line based on support / resistance slightly above/ below it . Please pay attention to it


Breakout expected in ABFRL Breakout expected in ABFRL @ price of 223-225. After BO stocks might move towards 280 with minor resistance of 245.
Disclaimer - this is just for educational purpose and not a trading or investment advise


Buy ABFRLA Symmetric Triangle formation has occurred on the weekly charts.
Above average high volume on breakout.
Also price has been in an expanding formation since 11th May 2020.
Price objective as per Triangle formation comes to 382.9
Other near term price targets are shown by green horizontal lines
Rising ADX line + Bullish MACD crossover on weekly charts further confirm the bullish trend
Stop Loss can be kept at 184.3
Risk/Reward Ratio is 4.35

Jk paper for buyingJk paper is near breakout level with good volume so may be prefer for short and medium term buying side.this is only for educational purposes.thanks

ABFRL just weak for 2 3 session to bounce back watch pattern carefully which is zig zag chart as shows all information about trends without time limit or against time
As per my Research will go to 195 once again to bounce back
As per long term view this stock is best to hold
Thank You
Samkit Jain

ABFRL ::: BULLISHDATE: 30 MAY 2021
INSTRUMENT: ADITYA BIRLA FASHION AND RETAIL LTD.
TREND: BUY
TIME FRAME: DAY
CMP: 191.05
BUY ABOVE: 195
STOP LOSS: 189
TGT 01: 201
TGT 02: 216
TGT 03: 224
DISCLAIMER:
We are not S E B I registered analysts.
Please consult your personal financial advisor before investing. We are not responsible for your profits/losses whatsoever.
Leave a comment that is helpful or encouraging.
Let's master the markets together.


ADITYA BIRLA FASION AND RETAIL LIMITED :: BULLISHDATE: 23/5/2021
INSTRUMENT: ABFRL
TREND: BUY
TIME FRAME: DAY
CMP: 188.50
BUY ABOVE: 190
STOP LOSS: 180
TGT 01: 205
TGT 02: 220
DISCLAIMER:
We are not S E B I registered analysts. Please consult your personal financial advisor before investing. We are not responsible for your profits/losses whatsoever.

ABFRLTrading near trend line support, Low risk buying resistance near 220-230 bullish if gives breakout above 230, SL 150


ABFRL - ASCENDING CHANNEL - Retesting the breakoutThe above analysis is done purely on basis of Price Action & Chart Patterns.
The analysis is done on daily TF hence price may take few days to few weeks in order to reach the targets
Logic, Entry range, SL are shown in image itself.
For target refer this image -
The above analysis is purely for educational purpose. Traders must do their own study before entering into any trade. Traders must trade as per their own risk taking capacity and money management.
Feel Free to comment for any query or suggestion regarding this stock or Price Action Analysis.
Checkout my other ideas to understand how one can earn from stock markets with simple trade setups.

