Proxy to growing industry - INFRAGood growing co. YOY. They are also diversifying their revenue with defence contracts and exports.
As a short term indicator, with good monsoon expected, their tractor sales should also get benefits of tailwinds.
Overall, favourable risk to reward ratio. Downside should provide opportunity for further averaging.
ACE trade ideas

ACE breaking of 200DMA Action Construction equipment limited a reowned company in the infrastructure sector which has its major business in supplying cranes to construction has given a slight breakout in the 200DMA line which is considered a good uptrend when backtested.
Stock was not moving as there was dumping of cranes by chinese companies so april 6 the Govt of india may levy a anti dumping duty which will be a huge positve for the stock


Best candle pattern to predict trend reversal
Best candle pattern to predict trend reversal. Best on my trend analysis for training and educational purpose

ACE CMP 1495.ACE Trading at 52 week high zone and all time hizone also.Only weekly candle giving a positive sign for a strong uptrend with the signal of upper bollinger band breakout.Volumes are good.Add to your wachlist and see how it perforn in coming days.Thanks for support.

Mid to Long-Term Investment PickACE LTP : 1340
Targets: 1460, 1560, 1660 🤞🏻
Long Term Targets :1860, 2060 , 2260🤞🏻🤞🏻
May add more on dips till 1240-1080.
For investors with a long-term perspective and the ability to add on dips or hold calmly.
Time Frame: 4 to 12 months 🤞🏻
Trade as per your risk management and investment plan.

POV: ACE : Pole and Flag PatternPOV: ACE : Pole and Flag Pattern
Chart Reading:
1. From May'22 constant Long Run formation, considered as Pole
2. After a long run, the script falls into consolidation and forms a Flag Pattern.
3. This consolidation takes around 170 sessions.
4. Trend and Momentum just started to improve.
5. Price trading around 200 SMA after a long history.
6. Wait for the breakout or Pullback Zone for entry.
For educational purposes only. This is not financial advice. Please consult a professional before making financial decisions.
#NiVYAMi

ACE: Bullish Momentum Ready to Take Off! **🚀 ACE: Bullish Momentum Ready to Take Off! 📈🔥**
**Why You Shouldn’t Miss This Opportunity:**
ACE is showing **strong bullish momentum** across multiple timeframes, and the chart is loaded with powerful signals pointing to a **potential breakout**! Whether you're eyeing a **swing trade** or looking for a **BTST** play, this stock is primed for gains. Here's why:
**🔥 Key Technicals:**
- **Strong Bullish Candle**: Daily, Weekly, and Monthly charts all flashing **Long White Candles**, signaling bullish strength across the board!
- **RSI Breakout**: RSI at **65**, confirming strength and breaking key resistance.
- **Volume Surge**: A **volume breakout** confirms price action is supported with high interest.
- **Stochastic at 98** and **CCI at 152**: Overbought territory, but indicating strong upward pressure.
- **MACD Bullish**: Continuing to support the bullish trend.
- **Donchian Band**: A **new high** created—possibility of a **major breakout**.
- **Bollinger Bands**: Positive breakout, signaling further upward movement.
- **EMA 50**: Price trending up with a **bullish crossover** forming—short-term strength.
- **EMA 100 & 200**: Choppy markets, but the short-term trend remains strong.
**📅 Latest Signal:**
- **Long White Candle** patterns forming on **Daily**, **Weekly**, and **Monthly** charts.
- **Bullish Engulfing** pattern on the **Monthly** chart, reinforcing strong upward momentum.
**💥 Why It’s a Strong Pick:**
With a **technical rating of strong bullish**, ACE is gearing up for possible **short-term gains**. The breakout setup is confirmed by multiple bullish signals, and it's showing strength across both price and volume. Whether you’re a **swing trader** or looking to capitalize on **BTST** opportunities, ACE is one to watch!
**🚨 Take Action NOW:**
Don't let this breakout pass you by! Set your alerts, add ACE to your watchlist, and stay ahead of the curve.
👉 **Add ACE to your watchlist now** and position yourself for the next big move!
🔔 **Set your alerts** for the breakout, and get ready for possible upside!

Action Construction Equipment Ltd (ACE) - Chart Analysis1. Price Pattern:
- A potential Cup and Handle formation is visible, which indicates a bullish continuation pattern.
- The price has tested key resistance levels and is currently consolidating within the trendline boundaries.
2. Support and Resistance:
- Key resistance levels: ₹1305, ₹1320 and ₹1485.30.
- Immediate support levels: ₹1210.70 and ₹1072.30.
- Broader support at ₹940.45, acting as a critical long-term demand zone.
3. Trendlines and Moving Averages:
- The chart shows a descending channel, providing both resistance and support zones.
- Key moving averages (20-day, 50-day, and 200-day) suggest a mixed trend, with the price hovering near the 20-day MA.
4. Trade Setup:
- A breakout above ₹1305 could signal a bullish rally toward higher resistance levels.
- Conversely, a breakdown below ₹1210 could lead to further downside toward ₹1072 or ₹940.

ACE S/RSupport and Resistance Levels:
Support Levels: These are price points (green line/shade) where a downward trend may be halted due to a concentration of buying interest. Imagine them as a safety net where buyers step in, preventing further decline.
Resistance Levels: Conversely, resistance levels (red line/shade) are where upward trends might stall due to increased selling interest. They act like a ceiling where sellers come in to push prices down.
Breakouts:
Bullish Breakout: When the price moves above resistance, it often indicates strong buying interest and the potential for a continued uptrend. Traders may view this as a signal to buy or hold.
Bearish Breakout: When the price falls below support, it can signal strong selling interest and the potential for a continued downtrend. Traders might see this as a cue to sell or avoid buying.
20 EMA (Exponential Moving Average):
Above 20 EMA(50 EMA): If the stock price is above the 20 EMA, it suggests a potential uptrend or bullish momentum.
Below 20 EMA: If the stock price is below the 20 EMA, it indicates a potential downtrend or bearish momentum.
Trendline: A trendline is a straight line drawn on a chart to represent the general direction of a data point set.
Uptrend Line: Drawn by connecting the lows in an upward trend. Indicates that the price is moving higher over time. Acts as a support level, where prices tend to bounce upward.
Downtrend Line: Drawn by connecting the highs in a downward trend. Indicates that the price is moving lower over time. It acts as a resistance level, where prices tend to drop.
RSI: RSI readings greater than the 70 level are overbought territory, and RSI readings lower than the 30 level are considered oversold territory.
Combining RSI with Support and Resistance:
Support Level: This is a price level where a stock tends to find buying interest, preventing it from falling further. If RSI is showing an oversold condition (below 30) and the price is near or at a strong support level, it could be a good buy signal.
Resistance Level: This is a price level where a stock tends to find selling interest, preventing it from rising further. If RSI is showing an overbought condition (above 70) and the price is near or at a strong resistance level, it could be a signal to sell or short the asset.
Disclaimer:
I am not a SEBI registered. The information provided here is for learning purposes only and should not be interpreted as financial advice. Consider the broader market context and consult with a qualified financial advisor before making investment decisions.

ACE on the Verge of a Massive Breakout!🔵 Bullish breakout at ₹1,398.40.
📊 Strong buy volume, with momentum building up for a breakout.
🎯 Next targets: ₹1,477.30, ₹1,602.50, and ₹1,693.75 on the upside.


good stock huge upside possiblefundamentally strong buy at 285 add on dips keep slwc 175 target 350/450/500

ACE breakout pullback Action construction Equipment(ACE) gave a breakout with good volume after consolidating for almost 1.5 years in a price range after a good run up. The script has given a pullback to the support levels of the Darvas box and nice thing is the pullback is with low volume which adds confidence. Looking at the graph the script can easily reach 400 levels with stop loss of 255 on daily closing basis. If we see the shot term trend(50dma) is now bullish and long term trend was flat which is also starting to incline upwards.
The stock has started making higher highs and higher lows which is a good sign


Short Term BullishShort Term Bullish view on ACE
Educational Purpose Only
Duration 1 Month. 25% upside possibility

ACE - will history repeats itself??Expecting bounce from 20EMA band.
Close below 20EMA low or below box can be treated as SL.

Action Construction Equipment Ltd has given a breakoutBreakout Stock
Action Construction Equipment Ltd.
Strong Uptrend Seen on Chart.
Volume Buildup Seen on Chart.
Stock is trading above 50 and 200d EMA.
Debt to Equity - 0.01
Action Construction long above 480 for 520 targetFalling in a channel formation and likely to give 520 as target once sustains above 480

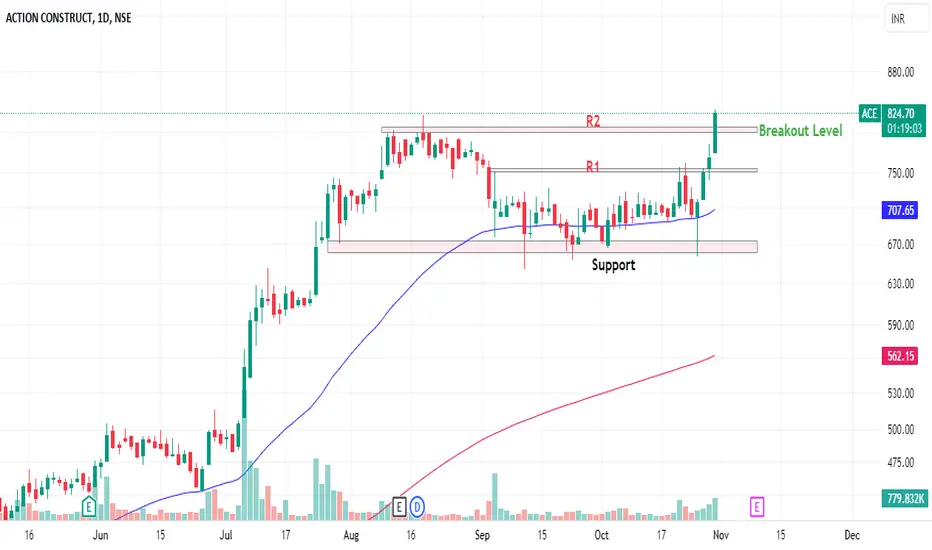
Action Construction Equipment Entry - 622 and above - wait for breakout and retest at 613 or 616
Tgt - 730
Timeframe - Swing Trade ( 2-3 weeks )
-- DISCLAIMER --
I am not a financial advisor or SEBI registered.
This is just a view.
Please DO YOUR OWN RESEARCH before investing in any stock.
Happy trading.
Peace.

Ace Ace move upside good value or returns last month
Moving upside and looks good target for this stock .

