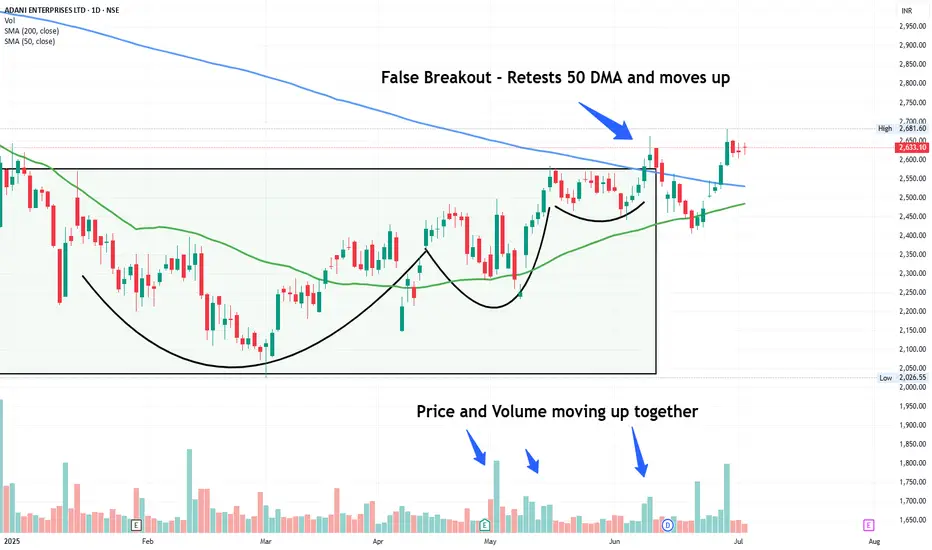
ADANIENT - ABV 2650 CLOSING BIG UPMOVE COMINGAdanienterprises after good consolidation ready for BIG BREAKOUT ABOVE 2650
IN COMING MONTHS EXPECT BIG TARGETS
ADANIENT trade ideas
Adani Enterprises Weekly Chart Analysis: Bullish ScenarioAdani Enterprises Weekly Chart Analysis: Bullish Scenario
-June 23 Weekly candle close above 200EMA(Bullish)
-EMA 9/21 Bullish cross on May 26
-MACD signal line crossing above zero line -Bullish
-If next couple weeks candles close above Support level i am expecting 3070 as next Buyside target(Long)

ADANIENT - time for a comeback?Thoughts mentioned on chart. It can attempt to fill the gaps it made while moving down. Good Risk reward on offer
Adani Enterprise BuyJune-24, 2025
Adani Enterprise is trading in a channel as marked. The stock took support at channel bottom. Buy @CMP (2505) wth SL of 2405 and target of 2650-2700.

Is ADANIENT Ready to Fly? – With Detailed Analysis & TargetDisclaimer:
This is not financial advice. Please do your own research or consult with a financial advisor before making any investment decisions. Investments in stocks can be risky and may result in loss of capital.

Adani enterprisesThis stock is breaking higher level in this 2025 in weekly timeframe. Technically stock is strong bullish. it may go 200points from here.just read the chart only for education purpose not any recommendation.


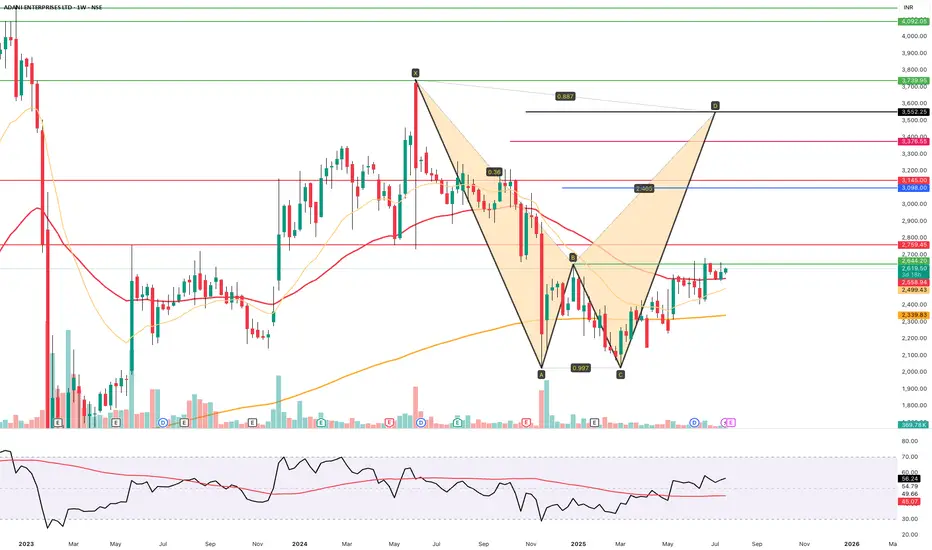
adani ent W pattern Adani Enterprises Limited is an Indian multinational publicly listed holding company and a part of Adani Group. It is headquartered in Ahmedabad and primarily involved in mining and trading of coal and iron ore.

ADANIENT | Buy @LTP | SL below 2190 | 1st Target 2900, 2nd 3525Disclaimer:
This is not financial advice. Please do your own research or consult with a financial advisor before making any investment decisions. Investments in stocks can be risky and may result in loss of capital.

ADANI Enterprises Ltd..... Seems to hv finally broken out.ADANI Enterprises Ltd..... Seems to hv finally broken out of the 38.2 % Fib Resistance, 2 days in a row (most likely). This is the third time its trying to break out of this zone. It's crossed the 50 ema & nearing the 200.
Needs to take out 2497, the recent high on a closing basis for a smoother ride up.
Am Bullish on the stock, one more reason being its subsidiary ' KUTCH COPPER ' which is to begin production full fledged very soon. Lets See.

ADANIENT KEY LEVELS FOR 13/05/2025// The core idea behind this indicator was sparked by a simple but powerful clue:
// 👉 "If you get one level, you get all levels."
// From that point onward, everything—the logic, calculation method, and application—has been developed independently through my own analysis and experience.
// I am not a seller, and no one taught me this system. This method is a result of my own effort and refinement.
///////////////////// Explanation /////////////////////
// This trading system is designed to eliminate blind trades by offering confirmation-based entry and exit points.
///////////////////// Entry/Exit Strategy /////////////////////
// - Use the BLACK line for long trades, and the RED line for short trades, in line with confirmation from your trading plan.
// - Stop Loss:
// - For long trades: below the RED line.
// - For short trades: above the BLACK line.
// - Take Profit:
// - For long trades: target the next RED line above.
// - For short trades: target the next BLACK line below.
///////////////////// Recommended Timeframe /////////////////////
// Use on a 5-minute chart for best results.
///////////////////// Disclaimer /////////////////////
// This setup is shared purely for educational purposes.
// I am not responsible for any gains or losses that may result from its use.
// Always use your own judgment and risk management.

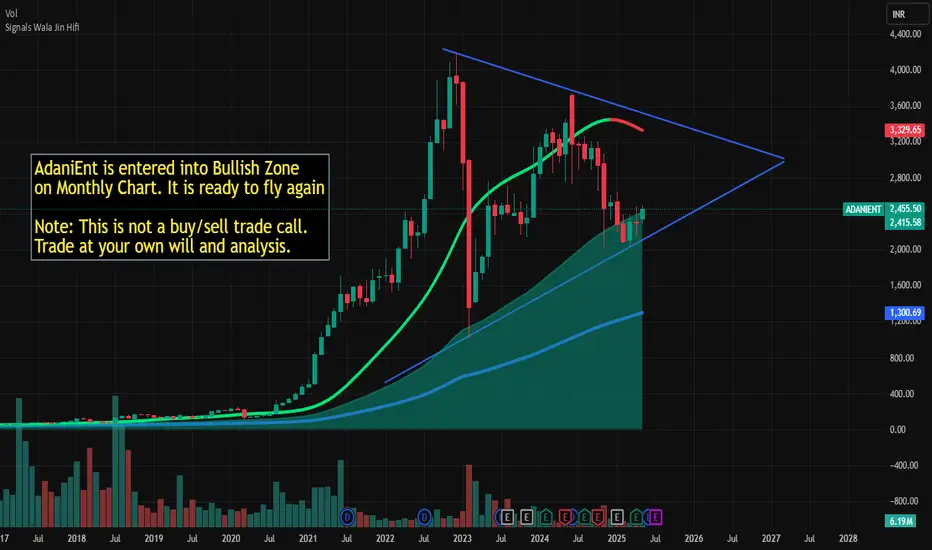
AdaniEnt is ready to fly againAdaniEnt is entered into Bullish Zone
on Monthly Chart. It is ready to fly again
Note: This is not a buy/sell trade call.
Trade at your own will and analysis.
Adani Results - didnt helpAdani results though shown more profit, unable to move above shows weakness in the stock. Will it survive. If moves below, then difficult to sustain for next 3 months, and have to wait for next quaterly results.
Revenue down due to their core business prices are low, while the volume remains the same.
Please take call as per your analysis and study. This info is for educational purpose only.

113 rupe dropped Adanient after signal 113 rupees dropped #Adanient share after generation of Signal "Becho" means sell by my custom designed indicator named SignalsWalaJin
Note: This is not a buy sell trade call. Trade at your own will. Use stop loss too.

INTO INDIA SERIES EP1: ADANI'S CURRYLIKE COMMENT FOLLOW
"for more nifty comment india"
Mumbai is the new New York
with increased activity says some US news source i read last year
So lets see whats going on outside of trumpville
Technical
price is downtrending
currently at a point in the downtrend where
so many different resistances and zones are intersecting
like the past lower highs
if you think my target is ludacris look at 09/01/23
youd call anyone that forecasted that crazy too but that was
breaking news... even though there was a BoS and continuation
the stock price hadnt been the same since looking so unatural
range spike in a week range spike in a week no steady progress
i wont speculate beyond the charts but like jan 3 2023 .....
Investor sentiment is often heavily influenced by news and reports, especially negative ones. The market has reacted strongly to the Hindenburg allegations, the volatility of the stock market, and overall uncertainty in global markets among recession fears.
this was interesting who knew there was life outside new york
this is like a drama cooking books of accounts "allegedly" like its curry bro was brewing something in hes pot
TATA CHEM ANALYSIS
A.I take for the drama lovers
The stock performance of Adani Enterprises has been influenced by a combination of factors, both internal and external. Here's a breakdown of the key factors at play:
### 1. **Corporate Governance and Financial Practices**
- **Scrutiny Over Financial Practices**: One of the major issues surrounding Adani Enterprises is its corporate governance. Critics have raised concerns over the group's financial transparency and related-party transactions. These issues have led to concerns about the sustainability of the group's business model.
- **Debt Levels**: The Adani Group, including Adani Enterprises, has been under scrutiny for its high levels of debt. Investors are wary of the risks associated with the group’s ability to service
its debt amid market uncertainty.
- **Hindenburg Report**: In January 2023, the Hindenburg Research report accused the Adani Group of stock manipulation and accounting fraud. This report caused a sharp drop in the stock price of Adani Enterprises, triggering investor fears. The group has denied these allegations, but the controversy lingers.
### 2. **Market Conditions**
- **Broader Market Volatility**: As with many companies, Adani Enterprises' stock price is affected by the broader market environment. Economic uncertainty, rising interest rates, inflation, and shifts in global market sentiment can all affect stock prices.
- **Global Economic Conditions**: Being a large conglomerate with interests in infrastructure, energy, and ports, Adani Enterprises is also sensitive to global supply chain issues, commodity price fluctuations, and changes in government policy.
### 3. **Political Factors**
- **Government Relations**: The Adani Group is often seen as having strong political ties in India, especially with the ruling party. This has been both a strength and a point of contention. On one hand, it has helped the company secure major contracts and government projects; on the other hand, it has drawn criticism regarding favoritism and crony capitalism.
- **Regulatory Scrutiny**: Increased regulatory scrutiny, especially after the allegations mentioned in the Hindenburg report, has led to greater risk for the company. The government’s stance on such matters, including potential investigations into corporate practices, could also have an impact on stock performance.
### 4. **Operational Challenges and Market Sentiment**
- **Diversification Efforts**: Adani Enterprises is a diversified conglomerate with businesses spanning ports, energy, agriculture, real estate, and more. While diversification can be a strength, it can also expose the company to risks in various sectors, each with its own challenges.
- **Market Sentiment**: Investor sentiment is often heavily influenced by news and reports, especially negative ones. The market has reacted strongly to the Hindenburg allegations, the volatility of the stock market, and overall uncertainty in global markets.
### 5. **Impact of Corporate Practices on Stock**
- **Corporate Practices Impact**: The corporate practices of Adani Enterprises have indeed had a significant impact on the stock. The allegations of fraudulent activities and questionable financial dealings have led to a loss of investor confidence. Trust in a company's management is crucial for stock performance, and doubts regarding the company's transparency and ethics can lead to stock sell-offs.
- **Investor Confidence**: If investors feel uncertain about a company’s leadership and practices, they may choose to sell their holdings or avoid buying, which can lead to a decrease in stock price. Adani Enterprises has faced significant outflows from institutional investors as a result of these concerns.
### In Conclusion:
Yes, corporate practices, especially concerns over governance and transparency, are having a significant impact on Adani Enterprises' stock. While market conditions and global factors also play a role, the company's internal issues—particularly related to its financial management and corporate governance—have created volatility and uncertainty. This has contributed to the stock price fluctuations and led to decreased investor confidence in the short term. However, the long-term impact will depend on how the company addresses these issues and whether it can restore confidence among investors.

Adani Enterprises - Breakout in Progress?The stock has been consolidating below a resistance level for several weeks. Today, it has given a breakout above the trendline resistance with good volume. This breakout could trigger a potential uptrend.
🔹 Target & Resistance:
Target: ₹2,654.70 (+13.49%)
Resistance Level: ₹2,654.70 (marked in purple)
🔹 Volume Confirmation:
The breakout is supported by increasing volume, indicating strong buying interest. If the stock sustains above the breakout level, we might see a strong upward move.
🔹 Trading Plan:
✅ Entry: On breakout retest or sustained move above resistance
🎯 Target: ₹2,654.70
🛑 Stop Loss: Below breakout zone
📢 Conclusion:
A successful breakout and close above this level could confirm bullish momentum. However, traders should watch for retest and price action confirmation before entering.

Adani Enterprises Ltd Long-Term Swing TradeTrade Setup: Long-Term Swing Trade
Entry Price: ₹2,250
Stop Loss: ₹2,100 (approx. 6.67% downside)
Target 1 (T1): ₹2,500 (approx. 11.1% upside)
Target 2 (T2): ₹2,700 (approx. 20% upside)
Risk-Reward Analysis:
Risk (Entry to SL): ₹150
Reward (Entry to T1): ₹250 (1.67 R:R)
Reward (Entry to T2): ₹450 (3 R:R)
Trade Rationale:
Technical Perspective: If the stock has strong support around ₹2,200–₹2,250 and a positive trend, it could provide a good entry.
Fundamental Outlook: Adani Enterprises is a high-beta stock; ensure it aligns with the broader market trend.
Volume & Momentum: Watch for increasing volumes and price action above key moving averages for confirmation.

Adani enterprises.....More pain left?NSE:ADANIENT ....Bearish view
Current price structure doesn't look good.
Should be possible 1750 or more lower target in upcoming days.

ADANIENT KEY LEVELS FOR 18/02/2025//description
// All credit goes to Tony for the concept of this indicator. His Trading View link: www.tradingview.com
// Note: The calculation method in this indicator differs from Tony's, but the concept is derived from his work.
I want to make it clear that I am not a seller, and this method was not taught to me by anyone. The original creator only gave me one clue:
👉 "If you get one level, you get all levels."
Everything else—the way I nail it the method and applied it—is my own work. I respect the original idea, but my approach is independent.
Explanation:
This trading system helps you avoid blind trades by providing confirmation for better entries and exits.
Entry/Exit Points:
- Entry/Exit Lines: Use the BLACK line for long trades and the RED line for short trades, based on confirmation from your trading plan.
- Stop Loss: For long trades, set the stop loss at the RED line below. For short trades, set it at the BLACK line above.
- Take Profit: For long trades, target the next RED line above. For short trades, target the next BLACK line below.
Timeframe:
Use a 5 mins timeframe for trading.
Risk Disclaimer:
This setup is for educational purposes. I'm not responsible for your gains or losses. Check the chart for more details.

3 scenarios for Adani EnterprisesI see 3 scenarios for Adani Enterprises....Keep in mind that most Adani stocks are heavily shorted by those with vested interests.....They are growing exponentially and that has ruffled many feathers locally and abroad. Fundamentally a great stock.....Technically the price looks weak.....Seriously nobody can grow in India without being accused of something or the other. In any case, the 3rd scenario where it goes to 250 levels is highly unlikely barring some black swan event. I'm buying here, with multiple sell order till ATH and beyond....Invest at your own risk....There are those that hate seeing Adani or any other Indian brand grow.....There are enemies at home too.....

ADANIENT KEY LEVELS FOR 17/02/2025//description
// All credit goes to Tony for the concept of this indicator. His Trading View link: www.tradingview.com
// Note: The calculation method in this indicator differs from Tony's, but the concept is derived from his work.
I want to make it clear that I am not a seller, and this method was not taught to me by anyone. The original creator only gave me one clue:
👉 "If you get one level, you get all levels."
Everything else—the way I nail it the method and applied it—is my own work. I respect the original idea, but my approach is independent.
Explanation:
This trading system helps you avoid blind trades by providing confirmation for better entries and exits.
Entry/Exit Points:
- Entry/Exit Lines: Use the BLACK line for long trades and the RED line for short trades, based on confirmation from your trading plan.
- Stop Loss: For long trades, set the stop loss at the RED line below. For short trades, set it at the BLACK line above.
- Take Profit: For long trades, target the next RED line above. For short trades, target the next BLACK line below.
Timeframe:
Use a 5 mins timeframe for trading.
Risk Disclaimer:
This setup is for educational purposes. I'm not responsible for your gains or losses. Check the chart for more details.

Adani Enterprise Download trending Adani Enterprises: Downtrend with Demand and Supply Zones
Adani Enterprises, a key player in the Adani Group, is currently experiencing a downtrend in its stock price. Despite this, both demand and supply zones are identifiable on its price chart, offering insights into potential price movements.
1. Supply Zone:
- A supply zone is an area where selling pressure historically outweighs buying pressure, often leading to price reversals or declines. For Adani Enterprises, this zone indicates a price level where the stock has previously faced resistance, and sellers may dominate again if the price approaches this area.
2. Demand Zone:
- A demand zone, on the other hand, is a price level where buying interest is strong, potentially leading to a bounce or reversal. For Adani Enterprises, this zone could act as a support level, attracting buyers and potentially halting the downtrend.
Key Observations:
- The presence of both zones suggests a battle between buyers and sellers, with the stock likely to react strongly at these levels.
- If the price breaks below the demand zone, the downtrend could accelerate, indicating further bearish momentum.
- Conversely, if the stock finds support in the demand zone and reverses, it could signal a potential upward movement, especially if it breaks past the supply zone.
Fundamental Context:
Adani Enterprises' performance is also influenced by broader market sentiment, company-specific developments, and macroeconomic factors. Recent news, financial results, or sector trends could impact the stock's movement alongside technical levels.
Conclusion:
Traders and investors should closely monitor how Adani Enterprises behaves around these zones. A combination of technical analysis and fundamental research will provide a clearer picture of potential entry or exit points.

ADANIENT KEY LEVEL FOR 06/02/2025**Explanation:**
This trading system helps you avoid blind trades by providing confirmation for better entries and exits.
**Entry/Exit Points:**
- **Entry/Exit Lines:** Use the BLACK line for long trades and the RED line for short trades, based on confirmation from your trading plan.
- **Stop Loss:** For long trades, set the stop loss at the RED line below. For short trades, set it at the BLACK line above.
- **Take Profit:** For long trades, target the next RED line above. For short trades, target the next BLACK line below.
**Timeframe:**
Use a 5 mins timeframe for trading.
**Risk Disclaimer:**
This setup is for educational purposes. I'm not responsible for your gains or losses. Check the chart for more details.
