AMBALALSA | Long-Term Ascending Triangle🔎 AMBALALSA | Long-Term Ascending Triangle 📈
This 20-year chart is a gem for pattern hunters!
AMBALALSA is consolidating within a massive ascending triangle, with price approaching the apex.
🟢 Support trendline intact since 2013
⚫ Resistance around ₹70–75 tested multiple times
⚖️ Current zone (₹38–42) is the make-or-break area!
➡️ Breakout = multiyear move likely
⬅️ Breakdown = long-term trend may pause
🧾 Decent earnings bounce in Mar 2024 after shaky quarters.
Is this the calm before the storm? 🌩️
AMBALALSA trade ideas

Stock Update - Ambalal Sarabhai Buy Zone: ₹54.80–₹61.86 (Key support levels).
Sell Target: ₹90.93 (Fibonacci 0.618 resistance).
🔑 Key Insights:
A triangle breakout was observed, signaling potential upside momentum.
Strong volumes support the trend.
Bullish vs Bearish sentiment: 6:3.
💡 Strategy: Monitor for sustained breakout above ₹61.86 or dip buy near ₹56.07.
Stay tuned for updates! 🚀
@investofino
#Nifty #Stocks #investofino

Ambala Sarabhai Limited For the first time in 8 years, Monthly candle crosses 50 SMA and looks good both technically and fundamentally.
Could be a turnaround story

Penny stock to go LONGBSE:AMBALALSA
Accumulate it in the range of 33-30....
it can give more than 2x return.
SL of 20.95 or monthly 50SMA....
Invest with your own risk....
Do your own analysis before investing, this is for educational purpose only.

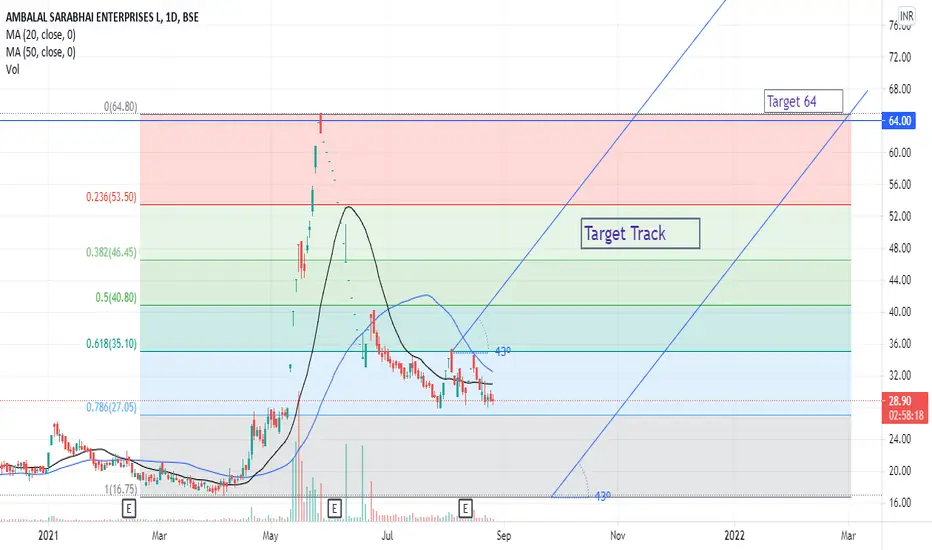
Target 64 ( 1 to 6 months )Step by step growing company, Good Fundamental , Target 64, Duration 1 to 6 months...