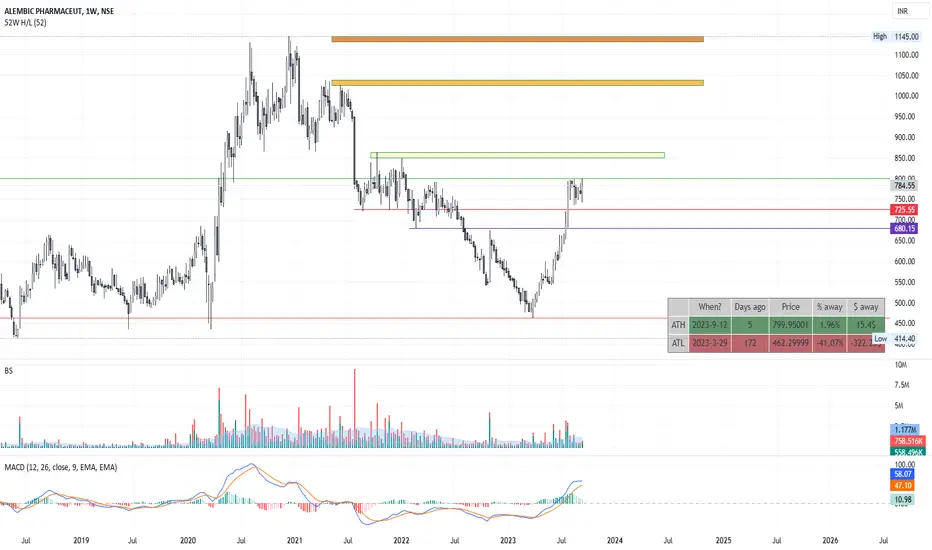
📈 Alembic Pharmaceuticals Limited Analysis 🎯 Target 940-1125📈 Alembic Pharmaceuticals Limited Analysis:
💼 Stock: Alembic Pharmaceuticals Limited.
🎯 Target: Rs. 940-1125.
🚩 Flag Breakout: Observed flag breakout pattern.
📊 Volume: Good volume during the breakout.
🕯️ Candle Closure: Strong candlestick closure.
Disclaimer:
This information is for educational purposes only and is not financial advice or a recommendation to buy or sell any stocks. Always conduct your own research and consult with a financial advisor before making investment decisions. Past performance is not indicative of future results, and investing carries inherent risks. Please invest responsibly.
APLLTD trade ideas

APLLTD looks bullishAPLLTD (Alembic Pharmaceuticals) looks bullish on monthly and weekly time frames. It is taking support on 60 RSI levels on a daily time frame. The price oscillated in the 798 to 740 range after a break out at 720 levels on July 28th. The price broke the resistance in the last two sessions with significant volume. And it is trading at its support now. It looks like a cup and handle pattern. It has broken the neckline of C&H with considerable volume. If it reverts from 790 levels, it would be a high trade with a 1: 5.5 risk-to-reward ratio.

alembic pharmaalembic pharma is likely to retrace at 725 or deep 680 then a good volume and upside move is expected
APLLTDLooks good for upmove.
Need to be little cautious.
Can stay in trend till the time 21 EMA is not broken.
Only for educational purpose.
Not a trade recommendation.

Alembic Pharma -Nice BreakoutAlembic Pharma -Nice Breakout
Capital to be deployed- 20k
Investing Price -760-775
Breakout Price -747
Stoploss -653
Targets -900-1021-1246
Do retweet so that it helps someone
#alembic #StocksInFocus #StocksToBuy #stockstowatch #StocksInNews #SwingTrading #BREAKOUTSTOCKS

APLLTD DAILY CHARTAPLLTD has broken out of its resistance @ 621 levels & now headed towards 805 levels.
Its only an observation & not any suggestion.

Alembic Pharma Bullish, Kindly do your own studyThis stock is in momentum in daily time frame
Monthly- MACD uptick
Weekly-MACD PCO and RSI is just above 60
Daily- Price is challenged upper bollinger band
After high volume candle price goes sideways
RSI is above 60 and ADX is at 40
EMAS positive crossover

APLLTD- Bearish Trend ContinueAPLLTD is in a bearish trend and with its pattern probability to go down further, today it was consolidated in a very narrow range after a breakdown.
So very high possibility of breakdown from the current consolidation zone and gives a very good risk reward. As you can also see POC created a very downside in the volume profile tool which gives very good confirmation.
Entry Price:- below @571
Stop Loss:- Above @575
Target:- !:1 or 1:2 or more

Buy APLLTDBuy above 610 for a target of 708 which is 16% from here on. SL will be 587. Risk to Reward will be 1:4.5

APLLTDBreak down. Support breaks. 44 period moving average in down trend. Break down in rsi level also.

Sell AlembicAlembic Pharma weekly chart shows
RSI about to dive out of ascending trendline, signaling a continuation of the larger downtrend.
MACD about to flip bearish again
Lower highs on the price chart + support of 61.8% Fib under risk of being breached.
Sell at 705 target 678-663 stop above 725

#aplltd #alembic #cipla #lauruslabs #biocon #granules #lupin #it#APLLTD
NSE:APLLTD
NSE:APLLTD
CMP: 725
Target: 815
SL: 700
RR > 3
TF < 3 months
Factors:
BULLISH WEDGE BREAKOUT
Trend Following
Rising Volume with rising Prices.
Flag pattern breakout.
Pennant Pattern Breakout with Bullish Candle.
Retest Successful.
Higher Highs & Higher Lows.
Broken above RESISTANCE levels
Trading at SUPPORT levels
Earnings are strong.
Bullish Wedge Breakout
Risk Return Ratio is healthy.
And
Rising from Double Bottom Pattern to Flag Pattern forming.
If you like my work KINDLY LIKE SHARE & FOLLOW this page for free Stock Recommendations.
With 💚 from Rachit Sethia

APLLTD takes a support company is goodcompany make consistent image of profit take risk with your money management hacks

APLLTDAPLLTD made a triangle pattern as well as inverse head n shoulder pattern & broke out of both patterns with more than average volumes.
Could be bought with mentioned stoploss & targets.

APLLTDAPL made inverted head n shoulder on daily & hourly charts with decent volumes.
Could be bought with mentioned stoploss & targets.

Alembic Pharma BreakoutThe stock has broken out and retested, therefore may undergo a reversal rally. Trade is supported by brokerage calls and Supports Nearby.
Risk Reward Ratio - 2:1
SL is placed below the support zone & the lower trendline. The target is placed near resistance.

BUY AROUND 765 TGT 835/925 AVG@ 740 AL BELOW 710 The stock had take a meaningful correction after the covid rally and is currently trading at good PE and book value. The stock is trading at par weekly moving averages and seems to be looking at bottom formation

Allembic Analysis-Long term1. Bullish Divergence
2. Volumetric profile at con flunce
3. Price corrected 10 % , yearly 25%

Alembic PharmaAlembic Pharma is breaking out of 7 months of consolidating range. Price got rejected multiple times at 820 levels. Today it broke above with good volumes & trading comfortable above it.
Could be bought with mentioned stoploss & target. Not to be missed breakout.


APLLTD - Bullish reversalPattern formed : Bullish Piercing on daily time frame
Trade Details
BUY
ENTRY 788
STOP LOSS 776
TARGET 812
PROFIT 2000
LOSS 1000
QUANTITY 83
Risk Reward 1:2
Resistance levels: 780-796-823
Support levels: 738-711-695
Reason for trade: On November 23rd the stock formed a Bullish Engulfing pattern at the level of 727.20 and moved up to the levels of 825. The stock has once again pulled itself up from the same level i.e todays low 727.15 and has closed at 764.25. Expecting a similar kind of move till 825.
Kindly follow support and resistance before entering your trades.
The selection of this stock is purely based on chart pattern and back reference.
Kindly maintain strict stop loss and book profits at 1:1 and trail.
Actual targets: 804-824

stock has give breakout in short termstock has give breakout in short term, stock looks positive in short run

APLLTsell below 776, and tgt is 766, sl 783
it forms a double top pattern NSE:APLLTD
plz do your own analysis before taking trade, this is for education purpose
