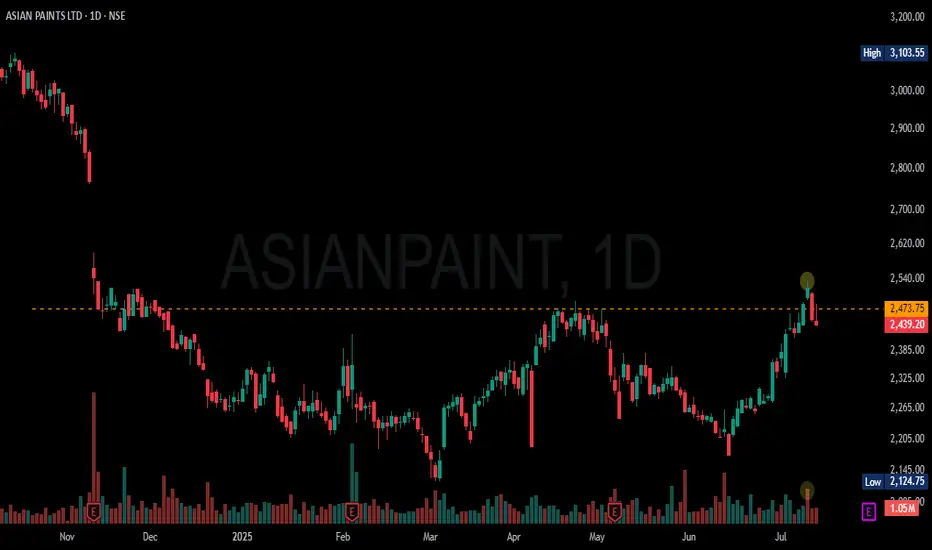
Asian Paint _ LongAsian Paints Long:
-Price takes support at 20 DEMA
-Bullish Engulfing Candle with Good Volume
- Target 200 DEMA
- SL: Close below 20 DEMA
- Enter when prices are favorable in the lower timeframe
ASIANPAINT trade ideas

ASIANPAINT IS BACKASIANPAINT Mega Cap is Back in Trend, on 9th July opened with gap up and closed above its resistance with good volume support indicates its down phase is over, watch for next week may go down before leaping forward.

ASIAN PAINTS --- Ready to Rock ? Looking Wise InvestmentASIAN PAINTS
weekly counts suggests if 2179 weekly close maintain than we assume completion 2
so impulse wave may start soon!!!!
its monopoly stock in his sector
long term buyers should definitely do their own analysis
open to test levels already shown in picture
invalidation for this pattern 2179 ( weekly close)

Asian Paints Long_Support @ 20 DEMA, Turnaround StoryAsian Paints Long:
-Price takes support at 50 DEMA & 20 DEMA
-Bullish Engulfing Candle with Good Volume
- Target 200 DEMA
- SL: Close below 20 DEMA
- Enter when prices are favorable in the lower timeframe

Asian PaintsIn my analysis, Asian Paints is gng to give breakout of downward trendline after making a decent base at this level from last ard 6 months, alongwith that it is forming a rounding bottom pattern also.
My SL is 2100 & Target is ard 2900.
Would appreciate ur ideas on this.

ASIANPAINT Technical Analysis📉 ASIANPAINT Technical Analysis (Daily Chart) – May 30, 2025
Current Price: ₹2,257.20
Change: -₹37.10 (-1.62%)
🔍 Chart Breakdown:
Support Trendline Broken: Price has decisively broken below the rising trendline, indicating bearish pressure.
Target Zone: ₹2,124.75 marked as the next potential downside target, aligning with previous demand/support.
FVG/GAP Zone: A Fair Value Gap (FVG) remains unfilled above ~₹2,600–₹2,680 — this may act as a resistance zone if price reverses.
Bearish Sentiment: Momentum is tilting bearish unless price recovers and reclaims the trendline.
📌 Outlook:
As long as price sustains below the trendline, downside towards ₹2,125 looks probable. Bulls may wait for signs of reversal near the target zone or reclaim of the trendline for long setups.

I am buying asian paints stock its trading above the key support resistance rainbow. one final dip into the rainbow should be the last one before it takes off. if it starts to close under the rainbow, i will sell covered call against my purchase.

Asian Paints Weekly Elliott Wave Analysis – March 17, 2025The price action of Asian Paints (NSE: ASIANPAINT) has been following a clear Elliott Wave structure.
The stock completed a primary wave (3) at the peak, with a truncated 5th wave, indicating weakness in the final leg of the impulse.
It is currently undergoing a wave (4) correction, following a W-X-Y pattern, with the price moving lower towards the 1.618 Fibonacci extension target at ₹1,931.
The invalidity level is set at ₹1,297, below which the larger wave structure would need reconsideration.
Indicators like RSI and MACD are reflecting oversold conditions, suggesting a potential bounce or consolidation before further downside.
A confirmation of wave (4) completion would signal the start of wave (5) towards new highs.
📉 Key Levels to Watch:
Support: ₹1,931 (1.618 Fib Extension)
Resistance: ₹2,492 (Wave Y previous support)
Invalidation Level: ₹1,297
This wave count suggests that Asian Paints is nearing the end of its correction phase. A reversal from the target zone could set the stage for the next bullish impulse.
📢 Disclaimer: I am not a SEBI-registered analyst. This analysis is for educational and study purposes only. Any profits or losses from trading based on this analysis are entirely your own responsibility. Do your own research before making any trading decisions.

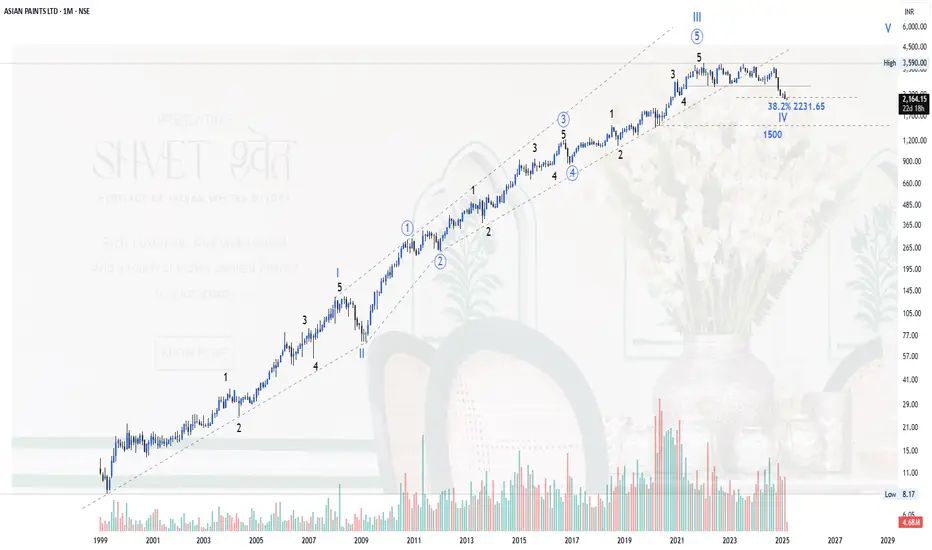
Asian Paint Chart Structure Elliott wavePlease refer to the chart of Asian Paints Ltd., have tried to put everything on chart. The Chart is a long term chart. It seems that it is progressing in wave IV of its higher degree waves. The wave IV has retraced moved than 38% of its wave III. Lower level may also be seen in near future.
Please check the chart and follow for such charts.
Regards
Asain Paints - Where is good opportunity to buy TechnicallyOn a Monthly time frame Asian Paints has penant breakdown.
With this possible levels could be 2300 / 2200 / 2150

ASIAN PAINT | SHORT | STBTASIAN PAINT tried to bottom out and the Buyers tried to take the price up above the Weekly Pivot. However, the sellers have hammered it again and now the stock looks set to test the 2183 price level.
Short position can be built on an STBT basis.

Asian Paints Bullish view From Here 1. **Decorative & Industrial Paints** – Asian Paints operates in both decorative and industrial coatings, catering to retail consumers and businesses with a wide range of products.
2. **Extensive Distribution Network** – The company has a strong supply chain, with over 70,000 dealers and a presence in more than 60 countries.
3. **Backward Integration** – Asian Paints manufactures key raw materials like emulsions and pigments, reducing dependency on external suppliers.
4. **Strong Brand & Innovation** – It invests heavily in branding, R&D, and technology to introduce premium, eco-friendly, and customized painting solutions.
5. **Home Improvement & Services** – Expanding beyond paints, it offers waterproofing, interior décor, and painting services under brands like "Beautiful Homes" and "Royale Play."

More than 40% return in asian paintif december Quater is good compare to last QoQ and YoY then asian paint will give more than 40% gain in next 3 to 4 months

ASIAN PAINTS | SHORT | INTRADAYASIAN PAINTS is correcting from the Highs. The Lower Highs being formed validate that the Sellers are in control at the moment.
I've taken short position for a target to 2271 price level which I'm assuming would be hit either today or tomorrow.

ASIANPAINT : Going Long for about 1.25% of the net capitalTook a position in the scrip, allocating about 1.25% of the net capital. I am expecting a potential upside of around 38% to the upper trendline of the channel that has formed.
I will consider adding to the position if the price falls approximately 23% from the current level and touches the longer timeframe trendline, which is a significant support level for the scrip.
📢📢📢
If my perspective changes or if I gather additional fundamental data that influences my views, I will provide updates accordingly.
Thank you for following along with this journey, and I remain committed to sharing insights and updates as my trading strategy evolves. As always, please feel free to reach out with any questions or comments.
Other posts related to this particular position and scrip, if any, will be attached underneath. Do check those out too.
Disclaimer: The analysis shared here is for informational purposes only and should not be considered as financial advice. Trading in all markets carries inherent risks, and past performance is not indicative of future results. It's essential to conduct your own research and assess your risk tolerance before making any investment decisions. The views expressed in this analysis are solely mine. It's important to note that I am not a SEBI registered analyst, so the analysis provided does not constitute formal investment advice under SEBI regulations.

ASIAN PAINT TO PAINT YOUR PORTFOLIO GREEN GREEN!!!!!!!Asian Paints is a prominent player in the Indian paint industry, known for its strong market presence and consistent financial performance. As of January 24, 2025, the stock is trading at ₹2,261.80, which is approximately 33% below its 52-week high of ₹3,394.00 reached on September 16, 2024.
Over the past three years, the stock has underperformed, declining by about 20%, while the benchmark index rose by nearly 40% in the same period. However, over a ten-year horizon, Asian Paints has delivered a compound annual growth rate (CAGR) of 13%, slightly outperforming the benchmark's 11% CAGR.
The company's trailing twelve-month (TTM) price-to-earnings (P/E) ratio stands at 69.86, significantly higher than the sector average of 19.44, indicating a premium valuation.
Analyst opinions are mixed: out of 34 analysts, 2 have issued a strong buy rating, 6 recommend a buy, 10 suggest holding, and 11 advise selling the stock.
In the last quarter, Asian Paints reported a net profit of ₹694.64 crores. The company maintains a healthy financial position with a debt-to-equity ratio of 0.00, indicating no significant debt burden.

ASIAN PAINT | STOP & REVERSE | LONGASIAN PAINT earlier trade SL has been hit and it is now clear that there is a reversal in play.
I have taken the SL and have entered a Fresh long position for the Feb series for a Target to 2350 price level.
New trade SL would be today's low.

ASIAN PAINT | SHORT | STBTASIAN PAINT has presented an opportunity for shorting.
The stock has taken out yesterdays low and broken the Weekly Pivot zone as well which is a good entry signal.
Target of 2213 is likely to be achieved within the next couple of days.
SL would be today's high.

IND//@version=5
strategy("Prajapati", overlay=true)
// Input Settings
riskPercent = input.float(3, title="Risk Percentage per Trade (%)", minval=0.1, step=0.1)
rewardRatio = input.float(3, title="Risk-Reward Ratio", minval=1.0)
capital = input.float(10000, title="Starting Capital ($)", minval=1)
atrMultiplier = input.float(1.5, title="ATR Multiplier for Stop Loss")
show_TT = input.bool(true, title = "Show T and TT")
show_sma = input.bool(true, title = "Show SMA")
// ATR Calculation for Volatility-based Stop-Loss
atrLength = input.int(14, title="ATR Length")
atrValue = ta.atr(atrLength)
stopLossDistance = atrValue * atrMultiplier
takeProfitDistance = stopLossDistance * rewardRatio
// Simple Moving Averages
fastMA = ta.sma(close, 13)
slowMA = ta.sma(close, 5)
// Entry and Exit Conditions using Simple Moving Averages
longCondition = ta.crossover(fastMA, slowMA)
shortCondition = ta.crossunder(fastMA, slowMA)
// Candlestick Patterns Functions
isBullishEngulfing() => (open > close and close > open and close >= open and close >= open and close - open > open - close )
isBearishEngulfing() => (close > open and open > close and open >= close and open >= close and open - close > close - open )
isHammer() => (((high - low) > 3 * (open - close)) and ((close - low) / (.001 + high - low) > 0.6) and ((open - low) / (.001 + high - low) > 0.6))
isInvertedHammer() => (((high - low) > 3 * (open - close)) and ((high - close) / (.001 + high - low) > 0.6) and ((high - open) / (.001 + high - low) > 0.6))
isBullishHarami() => (open > close and close > open and close <= open and close <= open and close - open < open - close )
isBearishHarami() => (close > open and open > close and open <= close and open <= close and open - close < close - open )
// Color Bars for Candlestick Patterns
barcolor(isBullishEngulfing() ? color.rgb(0, 102, 255) : na)
barcolor(isHammer() ? (#1f0cef) : na)
barcolor(isBullishHarami() ? color.rgb(0, 93, 214) : na)
barcolor(isBearishEngulfing() ? color.rgb(255, 196, 0) : na)
barcolor(isBearishHarami() ? color.rgb(251, 255, 0) : na)
barcolor(isInvertedHammer() ? color.rgb(247, 0, 247) : na)
// Calculate SMA for Visualization
sma_22 = ta.sma(close, 22)
lineColor = close > sma_22 ? color.black : color.black
plot(show_sma ? sma_22 : na, color=lineColor, linewidth=1)
// Determine T and TT Labels based on Conditions
candleCrossG = ta.crossover(close, sma_22)
candleCrossR = ta.crossunder(close, sma_22)
// Place Trades Based on Conditions
if (longCondition)
strategy.entry("BUY ", strategy.long)
strategy.exit("Take Profit", from_entry="Long", limit=close + takeProfitDistance, stop=close - stopLossDistance)
if (shortCondition)
strategy.entry("SELL", strategy.short)
strategy.exit("Take Profit", from_entry="Short", limit=close - takeProfitDistance, stop=close + stopLossDistance)
// Plotting Stop Loss and Take Profit Levels for Visualization
plot(longCondition ? close - stopLossDistance : na, color=na, title="Stop Loss", linewidth=1, style=plot.style_line)
plot(longCondition ? close + takeProfitDistance : na, color=na, title="Take Profit", linewidth=1, style=plot.style_line)
plot(shortCondition ? close + stopLossDistance : na, color=na, title="Stop Loss (Short)", linewidth=1, style=plot.style_line)
plot(shortCondition ? close - takeProfitDistance : na, color=na, title="Take Profit (Short)", linewidth=1, style=plot.style_line)

Asian Paint likely to shine againStock was in correction from Oct 2021.
There was time consuming triangle as internal "X"
and recently Y ended with down impulsive nature.
All marking are done on chart.
Triangle -> Thrust -> Tumble
Here after downside Thrust on completion,
so higher probability of Tumble which may result as upside move.

longThe market has presented an excellent opportunity for investors to enter long positions, with strong potential for growth over the coming months and years. For those looking to build a long-term position, it’s important to hold and accumulate on dips as the market progresses.
I’m currently long at the 2,300 level, and the 1,880 area also looks promising for new entries. These levels offer solid risk-reward setups, so consider using them as key buy zones.

