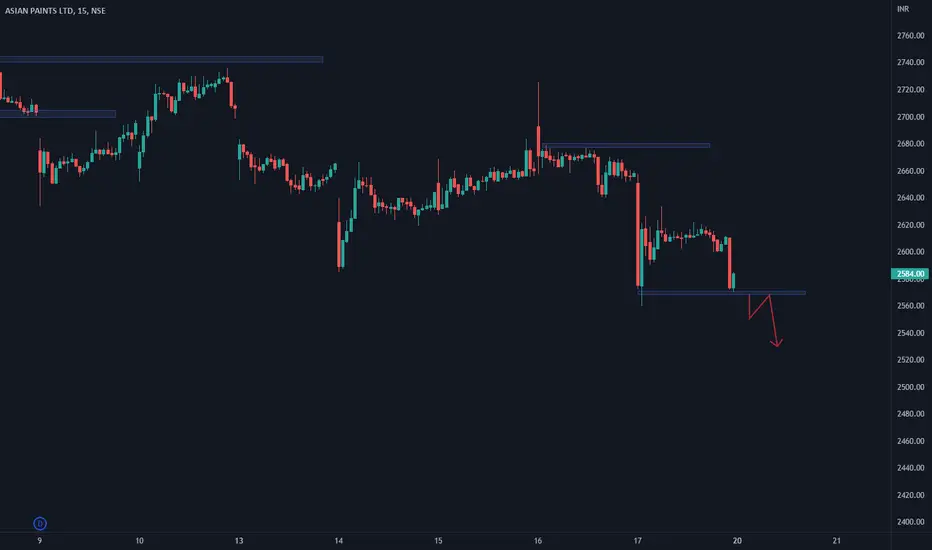
ASIANPAINT sell for intraday tradingASIANPAINT sell for intraday trading if stock break the given support level............
ASIANPAINT trade ideas

Asian Paints - Long off support zone (1 hr)Asian Pts (CMP 3400) trading longs can be tried here. SL 3320 hourly close
Issue is we might gap up tmw morning so will need to negotiate that

ASian paint sell for intraday tradingASian paint sell for intraday trading if stock break the given support level........

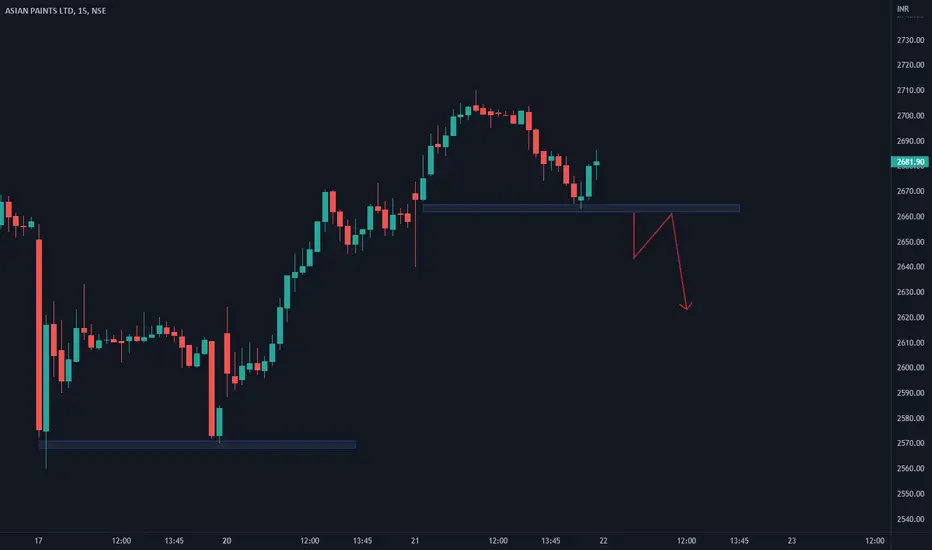
ASIANPAINT sell for intraday tradingASIANPAINT sell for intraday trading if stock break the given resistance level............
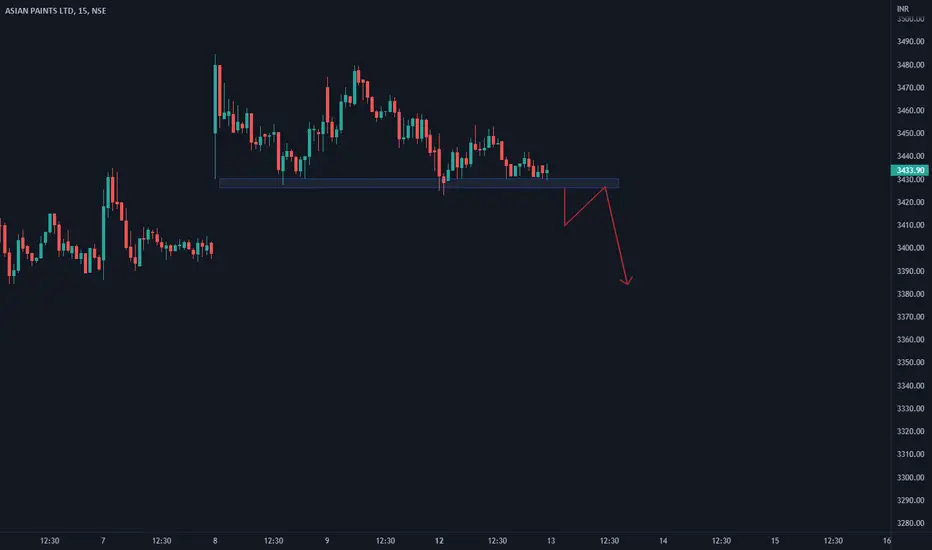
Asianpaint sell for intraday tradingAsianpaint sell for intraday trading if stock break the given support level............

#ASIANPAINT sell below 3300 tgt 3146 /3050 SL 3400 sell below 3300
tgt 3150 / 3050
SL 3400
Risk Reward 1: 1.5 & 1:2.5
current prices dont factor in high crude/energy prices especially ahead of winter in Europe

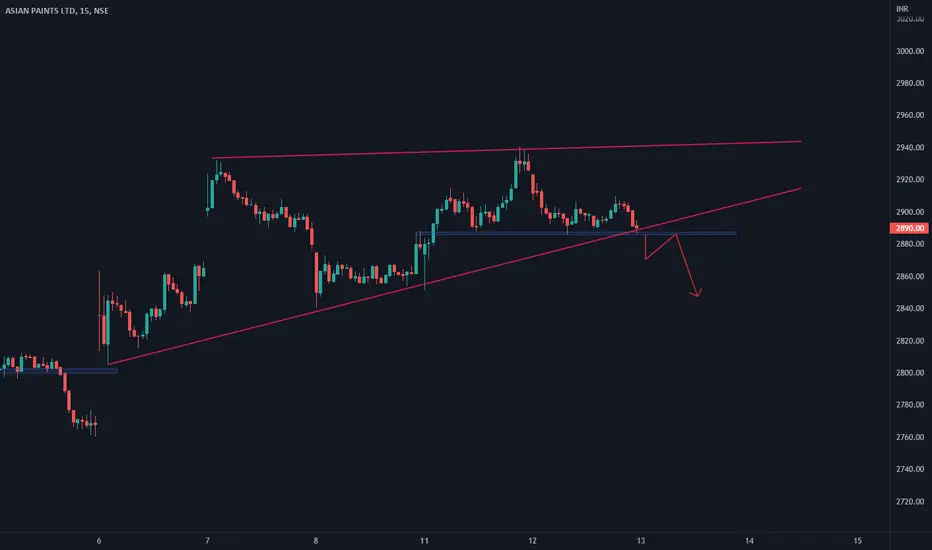
Asian Paint two to three days outlook Asian paint looking good to sell as it breaches its last support in the Friday trading session. All other aspects of the trading mark are on the chart. kindly go through it.

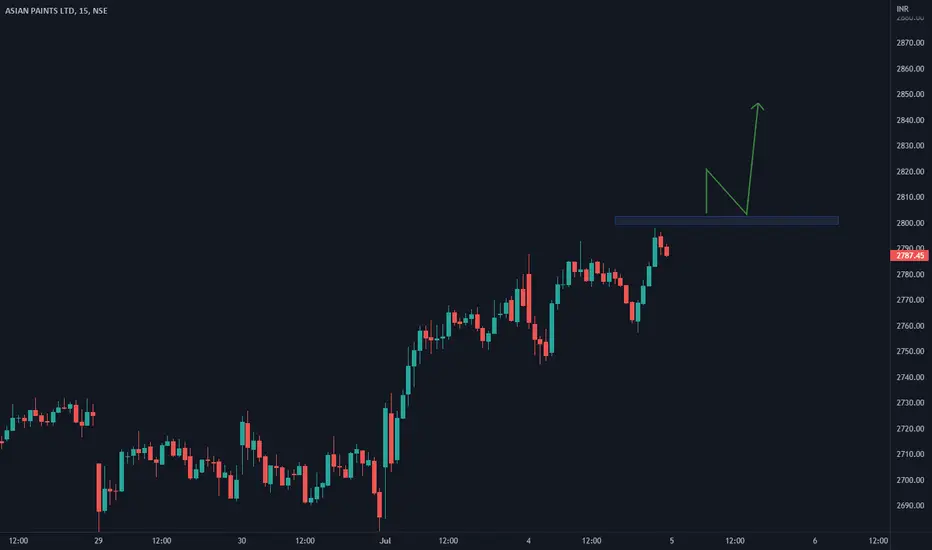
ASIANPAINT Buy for intraday trading ASIANPAINT Buy for intraday trading if stock break the given resistance zone.........

Asian Paints Short Term View (Month of August 2022 Only)Stay Long above - 3392, T1 - 3562, T2 - 3678, T3 - 3795, T4 - 4000...... SL - 3350
Short Below - 3340, T1 - 3245.20, T2 - 3114, T3 - 3014, T4 - 2953...... SL - 3392.60


Asian paint asian pain forming double bottom pattern in weekly chart it breaks neck line also , price may reache to that level.

Asian paints bearish harmonic pattern bearish Shark pattern complete, If this stock Break 3300 level , we see some corrections .
1st Target - 3200
Harmonic view , no recommendation.

asian paints ltdshare name : asian paints ltd
call type : shorting opportunity
- share is forming a downfall range
- 3016 is a good supply zone because we can see
a head and shoulder on daily time frame,
which is acting as a trend reversal
- 2599 is acting as a good demand zone
- we can sell this share around 3016 levels for
2599, if 2599 getting break we can see 2260
levels in upcoming months
- i am creating a imaginary picture for this share
thanks

Asian paints - turning bullish againOne of my favourite stock turning bullish again.
Stock made an inverse head and shoulder chart pattern and gave a breakout from immediate resistance. Next resistance and target of inverse h&s is same, which is 3175. Short term traders can capture this opportunity. You can keep a small stop loss of candle low that decisively breaks the sloping trend line.
Existing investors like me can increase their positions.

ASIANPAINT sell for intraday tradingASIANPAINT sell for intraday trading if stock break the traingle pattern downside then we will short the stock.......
ASIAN PAINTAsian paint
as per my view ABCDE correction wave
going on 5th wave of D wave and
one more wave correction pending of asianpaint

ASIANPAINT sell for intraday tradingASIANPAINT sell for intraday trading if stock break the given support level then we will enter in trade.......

Asian Paint Long OpportunityTrade active. Gave breakout with proper rules. So go long.
Trade at your own risk

ASIANPAINT buy for intraday tradingASIANPAINT buy for intraday trading if stock break the given resistance zone..............
ASIANPAINT sell for intraday tradingASIANPAINT sell for intraday trading if stock break the given support zone............
Price action analysis - ASIANPAINTNSE:ASIANPAINT had a good run up until recently and now it seems to have been topped out. In Weekly chart, rising wedge structure is formed and volume has declined with it. It suggests that buyers are losing the grip and sudden fall to 2625 with heavy volume confirms the reversal. Buyers stepped in from 2625 level and took the price higher but subsequent price action suggests that they have been exhausted and seem to be losing control. If price couldn't hold above 3100 level then it's going back to 2645. If it can't hold that one then it will go further down to 2275. Let's see what happens.

ASIANPAINT sell for intraday tradingASIANPAINT sell for intraday trading if stock break the given support level...............
ASIAN PAINTS - BULLISH HARMONIC PATTERN - GOOD ENTRY !Bullish Harmonic Pattern Established, possible targets mentioned in the chart
Disclaimer - This is not a buy or sell advice. I am sharing what I see on the chat & what I am trading, based on my own knowledge & understanding. Please consult your financial advisor before taking any bets in the stock market. I will not be responsible for any profit/loss you incur on your trades based on my published ideas.
