Asian paintsWait for traingle pattern break up or down.
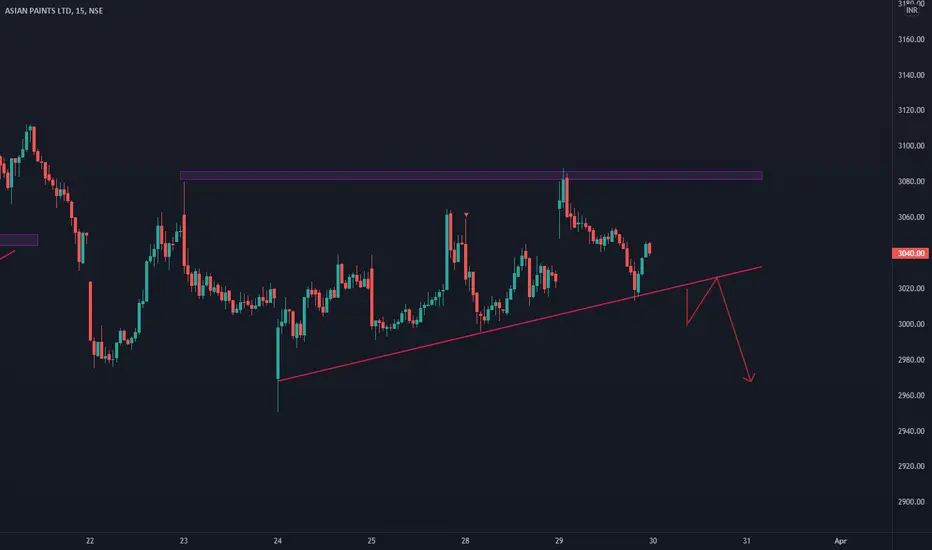
Stock moving down on Trend line resistance.
No trading zone.
ASIANPAINT trade ideas

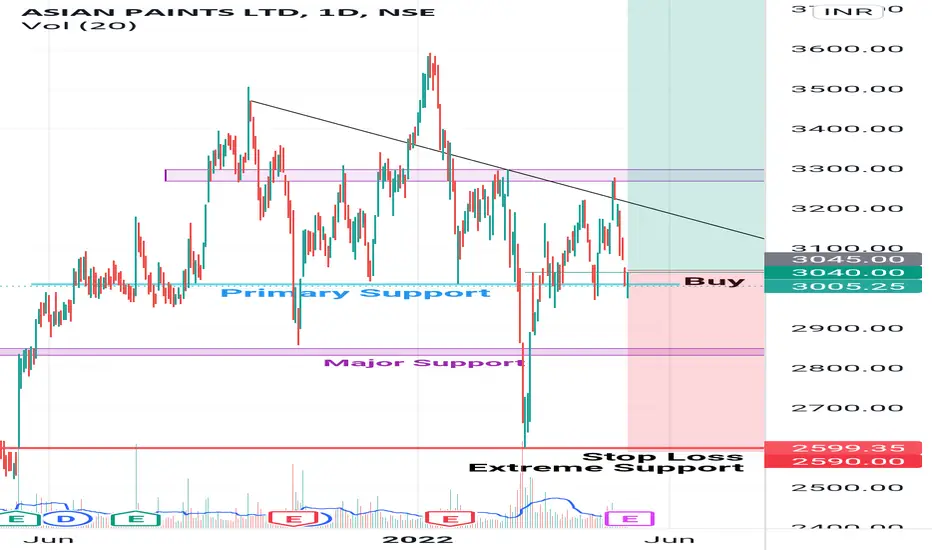
ASIAN PAINTS srtarted his jurney ....It's a long tern call.. As expeted price moved up. our buy done today. Now just wait for terget. ):

ASIAN PAINT for long Term Investment. 𝙰𝚂𝙸𝙰𝙽 𝙿𝙰𝙸𝙽𝚃 𝙸𝚂 𝙾𝙽 𝚅𝙴𝚁𝚈 𝙶𝙾𝙾𝙳 𝙿𝙾𝚂𝙸𝚃𝙸𝙾𝙽. 𝙸𝚃𝚂 𝙰 𝙰𝚁𝚃𝚁𝙰𝙲𝚃𝙸𝚅𝙴 𝚃𝙸𝙼𝙴 𝚃𝙾 𝙱𝚄𝚈 𝚃𝙷𝙸𝚂 𝚂𝙷𝙰𝚁𝙴.
𝙱𝚄𝚈 𝙰𝙱𝙾𝚅𝙴 @ 3045/- 𝚕𝚎𝚟𝚎𝚕.. 𝚄𝚙𝚝𝚘 3165/- 𝚕𝚎𝚟𝚎𝚕 𝚒𝚜 𝚋𝚞𝚢𝚒𝚗𝚐 𝚣𝚘𝚗𝚎.
The stock stand on support level.. And there are several Support from this level.
* This is only my study. Please consultant with your financial advisor to Investment.
asian paints 1dtfLook like a downside opportunity as of minimum targets of 2950, 2849,2650 and all levels are valid for the upcoming week only

view on ASIAN PAINTS Ltd.DISCLAIMER: There is no guarantee of profits or no exceptions from losses.
The technical analysis provided on the chart is solely the personal views of my research.
You are advised to rely on your own judgments while investing/Trading decisions.
Past performance is not an indicator of future returns. Investment is subject to market risks.
Seek help of your financial advisors before investing/trading.

ASIANPAINT sell for intraday tradingASIANPAINT sell for intraday trading if stock break the given support zone............

ASAINPAINT buy for intraday tradingASAINPAINT buy for intraday trading if stock break the downtrendline upside then we will see goog momentum........
Buy Long- Asian paints at 3248 for target of 3876, SL-3217Inverted Head & shoulder pattern break out, expected Return-19.33% NSE:ASIANPAINT


ASIANPAINT buy for intraday tradingASIANPAINT buy for intraday trading if stock break the given resistance zone.......

ASIANPAINTASIANPAINT on 4 hour time frame
Head and Shoulder.
NSE:ASIANPAINT
{Educational Purpose only}

Asian Paints is getting readyLong Idea:
Above 3168, may give a good move with the potential to reach 3314......!

ASIANPAINT buy for intraday tradingASIANPAINT buy for intraday trading if stock break the resistance level........
ASIAN PAINTS ON CRUCIAL LEVELSASIAN PAINTS is consolidating in an upward channel pattern making Higher Highs and Higher lows. Supply zone seen at 3155. Break above that level and sustain for 15-30mins can give atleast 200 rupees move.

ASAINPAINT buy for intraday tradingASAINPAINT buy for intraday trading if stock and NIFTY also strong then we will enter in trade.....

ASIAN PAINTS LONGif its breck 3200 then we are going for long and also breck the level of 3500 is jackpot to all of us.
wish you to a great day. Thank you............


ASIANPAINT buy for intraday tradingASIANPAINT buy for intraday trading if stock and nifty also strong then we will buy the stock.......
ASIANPAINT sell for intraday tradingASIANPAINT sell for intraday trading if Market also weak then we will short the the stock,...
ASIANPAINT sell for intraday tradingASIANPAINT sell for intraday trading if stock and NIFTY also weak then we will short the stock.....


Asian paint looking good for shortingafter consistent up rally stock should take a pause between 3000 to 3200, I don't think stock could go up from here because its already been stretch a lot its been five days stock is going up And now fed report came and its slightly negative so my view is downward for some days until its beaks 3200 because here resistance on weekly chart I know crude prices are falling but that not how market should work right, commodities are different its take time commodities supply and demand gap can not fill in just week it takes time that is reason why prefer selling position in intraday btst for monday . FOR swing traders its great opportunity to add if its retrace to 200 ema and got support at 3000 u can add some qt to your account for long term the long term view of this stock is bullish as per its fundamental and past history chart analysis i think its better to avoid building new bullish position unless its retrace a little bit thank you
