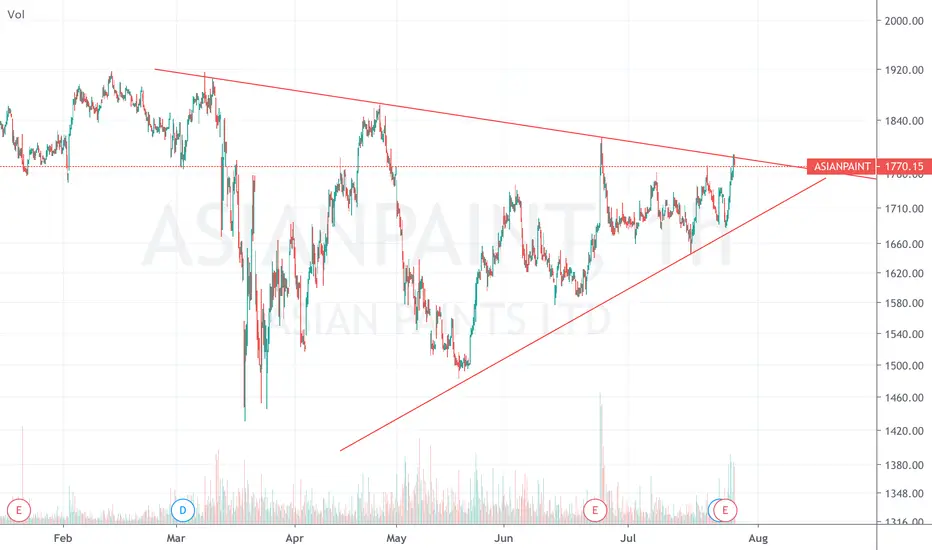
Asian Paints break outAsian paints has already crossed triangle pattern breakout but wait for it to retrace to 1791 and then buy... if it crosses 1818 then retrace will not happen so buy above it and it will fly more than pre covid levels... Asian paints is the best stock to hold for 2 or 3 months... even if you had loss just hold it atleast a year
ASIANPAINT trade ideas


Asian Paint Bull pattern observed... #asianpaints Asian Paint Bull pattern observed... #asianpaints
#asianpaintanalysis
#asianpaintpositionallevels

Asian paints Hello!! Asian paints a very famous company in India is in an uptrend now but since it just broke out today and given a really big move, therefore, I'm thinking that it will now retrace a bit maybe 50-80 pt.s if it didn't break the resistance that hard red line. let's see what will happen in the next market day. #learner #my_view

SET UP IN ASIAN PAINTSr1- resistance 1
r2- resistance 2
t1- target 1
t2- target 2
only for educational purpose.


ASIANPAINTSNSE:ASIANPAINT
KEEP AN EYE ON TRENDLINE, IT MIGHT BLAST ON EITHER SIDE
******************************************************************************************************************************************************************
Hi all,
Its pleasure to have you all here.
I have started putting these charts as a contribution from my side to all people who are new to business, as I had to struggle a lot without any sources at disposal. So please consider this a just small contribution from my side.
Few Honest Disclosures:
1. Any idea shared is my personal view, its not a recommendation, neither any kind of paid propaganda, so please
do your bit of research.
2. Ideas shared does not mean that I trade all or have position in them, this is just a helping hand to all.
3. I expect no comments or like nor any negativity, as I said its just a small helping hand from my side, please plan your risk and trade as per your capacity.
4. To trade in Cash, options or futures is your sole choice and your own risk
5. I am no expert in Tech Indicators, I believe in support resistance and trendline theory, you may use this as a supplement theory for better results.
6. I work for my own living, this is a hobby which I do sincerely to help anyone who might come across my charts.
***********************************************************************************************************************************************


SHORT ASIAN PAINTS CE 1800 - Sideways to downtrendSHORT ASIAN PAINTS CE 1800 @ 31/32
Qty 2 lots
TRGT - 50% reduction in premium
SL - 1832


Asian Paints - Breaking outAsian Paints breaking out at 1780 levels from box.
Resistance is around 1840 levels.
It usually has long bars. Difficult to trade.
So as usual traders can become investors. if it goes in wrong way.
But it is a very good stock.
So being an investor is also very good.

ASAIN PAINTS LTDBullish Crab TYPE 2 for SCALPING
Earlier this patterns given good reaction on Type1 entry now price again reached prz making its a TYPE2 Entry which is REVERSAL
Now with confirmation from a BULLISH CANDLE with RSI above 30
POTENTIAL BUY

Long Call Asian Paint - Operator moveHello Friends,
The best operator move found on the Asian paint chart. The way Chart formed by the operator i am very confident that next week this stock will give good move. Below are my observation :-
1. Operator initiate good buying at the start of the week.
2. Stock holds the level of 1670. 1680 level which created the support zone.
3. All the selling getting absorb at the same level.
4. at 1hr chart seen the huge buying which gave the confidence to initiate the trade in same.
5. 50, 200 EMA cross over at support zone.
Entry 1690 -1700, SL 50-60 points Target 1800
Regards,
Satish

Short Side on Asian PaintHangging man candle formation on daily chart.
Today's selling volume is huge.
Bearish cross over on MACD daily chart.
SL 1746-1750
Target 1570 Positional


ASIAN PAINTS short term buyI have provided Target line and support line, subject to OBV sustaining above resistance line.


