Astral_Price Rejection @ 200 Daily EMA_ ShortPrice rejection at 200 DEMA with Bearish Engulfing Pattern
Short when the risk (Entry Price to Stop Loss) is favorable.
ASTRAL trade ideas

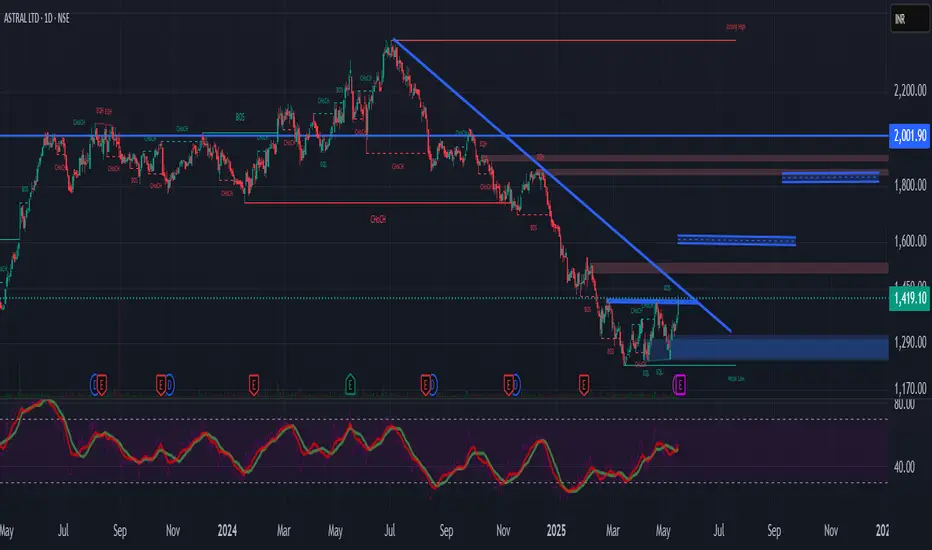
Reversal Trade in ASTRAL1. Consolidation breakout
2. Positive Divergence on RSI
3. Volume pop up
4. MACD signal turning green
5. RSI near 70

ASTRAL Flag Pole BreakoutASTRAL Flag Pole Breakout
T1 - 58%
T2 - 213%
Breakout strategy seen with moderate Volume Increase

Review and plan for 22nd May 2025 Nifty future and banknifty future analysis and intraday plan.
Quarterly results.
This video is for information/education purpose only. you are 100% responsible for any actions you take by reading/viewing this post.
please consult your financial advisor before taking any action.
----Vinaykumar hiremath, CMT

astral ltd a good fundamentally strong stock with good technicalastral had formed a nice base and started upmove looks good for medium to long term

ASTRALStock is trading in exactly in Fibonacci retracement zone and with horizontal support in weekly timfraempossibility of reversals towards upward.

Cup & Handle Pattern Breakout - ASTRALTechnical Analysis:
Current Price: ₹1419 (as per the image)
Target 1: ₹1600 (based on small Cup & Handle breakout, potential 200 point return)
Target 2: ₹1850 (after Super Trendline breakout)
Timeframe: 1 to 3 months (for targets to be achieved)
Integrated Analysis:
Bullish Technical Setup: You've identified a potential small Cup & Handle breakout, which, if confirmed with strong volume, could lead to the initial target of ₹1600. The subsequent Super Trendline breakout would further strengthen the bullish case and support the higher target of ₹1850.
High P/E: Astral trades at a significantly higher P/E (73.1) compared to the industry average (26.5). This suggests that the market has high growth expectations for the company.
Mixed EPS: While the latest quarter's EPS (₹4.25) is slightly higher than the previous quarter (₹4.09), the overall Profit Growth is negative (-7.52%). This indicates that while the company is profitable, its profitability has declined year-over-year.
Positive EPS Trend: The EPS of ₹19.6 is higher than the EPS preceding year of ₹17.0, and the EPS last year, which is ₹20.3.
Key Factors to Monitor:
Breakout Confirmation: As always, strong volume is crucial to confirm the validity of both the Cup & Handle and the Super Trendline breakouts.
Sustainability of Growth: The company needs to demonstrate that it can return to a positive profit growth trajectory to justify its high P/E ratio.
Future Earnings: Upcoming quarterly results will be critical to see if the company can maintain or improve its EPS.
Industry Dynamics: Any positive developments in the pipes and fittings sector could benefit Astral.
Conclusion:
The technical setup suggests a strong bullish potential for Astral, with targets of ₹1600 and ₹1850. However, the high P/E ratio and negative profit growth are important considerations. The market is likely pricing in future growth, and the company's ability to deliver on these expectations will determine whether it can reach these targets

ASTRAL LTD Buy opportunityThe price respecting significant support level around ₹1,200 - ₹1,300.
This indicates strong buying interest at these levels.
Wait for the breakout for less risk. I'm already long from here.

we can long on astral from the cmp 1343 2nd time retest the same level and we got small green candle on the given rangeof buyer area we can go long from here for the target of new high only for ling term view only we can consider
cmp - 1343
sl - 160 points from the the entry level
targe - new high from the swing level

ASTRAL LTD | At Key Trendline Resistance | Breakout or Rejection🟢 Buy Recommendation (Breakout Trade)
Entry: Buy only on breakout and daily close above ₹1,420–₹1,430 (above trendline resistance).
Target 1: ₹1,550
Target 2: ₹1,650
Stop Loss: ₹1,320 (below recent consolidation support)
📌 Rationale: If price breaks above the trendline on good volume and closes above ₹1,430, a trend reversal may begin.
🔴 Sell/Short Recommendation (Rejection Trade)
Entry: Sell if the price gets rejected from ₹1,400–₹1,420 and shows a red candle (confirmation).
Target 1: ₹1,280
Target 2: ₹1,180
Stop Loss: ₹1,445 (above the trendline)
📌 Rationale: If the price fails to break the trendline, it could resume the downtrend. RSI is overbought, and sellers might take over.
for educational purposes only

ASTRAL SWING TRADE SETUP📊 Price Action & Trend Analysis
Analyzing market trends using price action, key support/resistance levels, and candlestick patterns to identify high-probability trade setups.
Always follow the trend and manage risk wisely!
Price Action Analysis Interprets Market Movements Using Patterns And Trends On Price Charts.
👉👉👉Follow us for Live Market Views/Trades/Analysis/News Updates.

#ASTRAL#ASTRAL ltd at crucial juncture.. A CLOSE BELOW 1305, Opens up 1185 to 1250 levels as per chart..

ASTRAL swing reversal stock is forming inside bar candle stick pattern at the support & the RSI is below 30
likely good R:R
For a successful entry, we should ideally see a strong 1day candle on our chart—it’s crucial to use that timeframe.
Following the breakout candle of inside bar, the ideal entry point would be after a consecutive candle that breaks above the previous candle
As always, remember to do your own research before making any investment decisions!

Astral: Attempting to Catch the Bottom!🚀 Astral: Attempting to Catch the Bottom! 🚀
Current Market Price: 1822
Stop Loss: 1700
Targets: 1920, 2020
Astral is positioned at a long-term support level and the critical 61.8% Fibonacci retracement level. These levels are historically strong zones for potential bounces, making it an exciting opportunity for bottom-fishing.
📈 Strategy:
Create positions in a staggered manner to minimize risk.
Momentum could accelerate above 2164, which is the 61.8% level from the bounce point.
📉 Disclaimer: As a non-SEBI registered analyst, I recommend conducting thorough research or seeking advice from financial professionals before making investment decisions.
#Astral #TechnicalAnalysis #FibonacciLevels #SupportZone #InvestmentOpportunities #MarketMomentum

Astral Pipes: Is This a Buying Opportunity After a 35% Drop?The current price of Astral Pipes is ₹1630, with net income showing volatility but limited growth. A demand zone at ₹1530 has historically triggered trend reversals. Ideal buy levels are ₹1330 and ₹1180, where stronger support exists.
**Technical Overview**
- **Far below the 200-day moving average**: Indicates bearish momentum with room for reversal.
- **RSI is oversold**: Suggests selling pressure is nearing exhaustion.
**Additional Factors**
- **Post-Monsoon Recovery**: Construction activity typically increases after the rainy season, boosting demand.
- **Economic Tailwinds**: Improved macro conditions could drive infrastructure and housing growth, favoring Astral's product demand.
- **Commodity Price Impact**: Falling raw material costs (PVC resin) may improve margins.
- **Industry Position**: Astral's market leadership and brand strength offer resilience once demand returns.
**Strategy**
- **Buy near ₹1330 and ₹1180** for better risk-reward.
- **Stop-loss**: Not applicable; I would consider this a buying opportunity if fundamentals and management guidance remain strong.
- **Monitor earnings and management guidance** for signs of margin improvement and demand recovery.

Astral buy zone 1450 to 1550 Zone for 1 year HEllo Frds,
Astral available for best investment , accumulate from current price level.
company already CAPEX done .
one of the leader in their segment .
uppder target expected 2300-2600-2800 in Next bull run.

DEEPAKNTR : Potential recovery aheadTechnical Analysis of Deepak Nitrite Ltd. (DEEPAKNTR) - Daily Chart 📉📊
🚀 A detailed dive into the technicals of DEEPAKNTR to identify key levels, potential zones, and actionable insights for traders and investors!
Overview:
The daily chart of Deepak Nitrite highlights critical price zones, offering insights into strategic entry and exit points. Let’s decode the price action and trend!
Key Levels and Zones:
🔹 Current Price: ₹2,571.25 (-₹30.65 | -1.18%)
Support and Buying Zones:
🟢 First Buy Zone (Optimal Trader Zone): ₹2,546 - ₹2,602
Potential entry point for traders seeking short-term price movement.
🟢 Second Buying Zone: ₹2,386 - ₹2,431
Secondary entry level for long-term investors aiming for a safer risk-reward balance.
Target Zones:
🎯 Options/Swing Target: ₹2,800 - ₹2,828
Medium-term target for swing traders and options positions.
🎯 Ultimate Target Zone: ₹3,018
Indicates a significant bullish breakout if reached.
Stop Loss:
🚫 Price: ₹2,261.20
A critical level to invalidate the bullish setup, ensuring risk management.
📋 Additional Insights:
📉 Change of Character (CHoCH):
Two instances of CHoCH on the chart signal potential trend reversals or sentiment shifts.
📊 Wave B Retracement Zone:
Highlighted in gray, this zone marks a corrective phase, possibly consolidating before the next bullish impulsive move.
Educational Note:
Always focus on identifying key levels, setting a stop loss, and using technical indicators like CHoCH and retracement zones to enhance decision-making. Patience and discipline in trading can yield favorable results.
📢 Disclaimer:
This analysis is for educational purposes only and does not constitute financial advice. Trading involves risk, and you should conduct thorough research or consult a financial advisor before making any decisions.
#DeepakNitrite #TechnicalAnalysis #TradingPlan #StockMarket #Investment

ASTRAL : what is in pipeline next?Technical Analysis of Astral Ltd. (ASTRAL) - Daily Chart
📊 Overview:
The daily chart of Astral Ltd. reveals a sideways trading pattern with prices consolidating within a defined range. Here's a breakdown of key technical levels and potential trade setups:
Key Levels and Zones:
🔹 Current Price: ₹1,711.00
Support and Buying Zones:
First Buy Zone: ₹1,686 - ₹1,709
Second Buy Zone: ₹1,545 - ₹1,488
Target Zone:
Target Price Range: ₹2,083 - ₹2,140
Stop Loss:
Price: ₹1,440 (on the daily chart)
📉 Chart Analysis:
Wave Patterns: The chart identifies a series of wave patterns, including:
Wave A: Marks the initial low point.
Wave B: The subsequent high following Wave A.
Wave C: Indicates a lower point after Wave B, completing a corrective wave pattern.
CHoCH (Change of Character): Marks a potential reversal or significant change in trend, indicated at critical levels.
Deep Retracement Zone: The area between ₹1,645.60 and ₹1,545.55 acts as a strong support level, highlighting a potential accumulation zone.
Volume Bars: High-volume bars at the chart's bottom indicate increased trading activity.
Projected Price Movements: Green trend lines show potential upward price movements and corrections, aligning with the wave structure.
📋 Trade Plan:
Entry Point:
Enter a long position in the First Buy Zone (₹1,686 - ₹1,709) .
Alternatively, consider the Second Buy Zone (₹1,545 - ₹1,488) for a deeper retracement entry.
Target:
Aim for the Target Zone (₹2,083 - ₹2,140) .
Stop Loss:
Place a stop loss at ₹1,440 to minimize risk.
Conclusion:
Astral Ltd.'s daily chart highlights crucial support and resistance levels, offering potential entry and exit points. Traders should carefully monitor price action within the defined zones to seize profitable trading opportunities with a favorable risk-reward ratio.
📢 Disclaimer:
This analysis is for educational purposes only and does not constitute financial advice. Always conduct thorough research and consult a qualified financial advisor before making any investment decisions.
#AstralLtd #TechnicalAnalysis #TradingPlan #StockMarket #Investment


#ASTRAL:NSEASTRAL has recently hit 2143 and retraced to 1894 now between the 50 & 61% FIBO, keep in watchlist Entry above 1966 SL 1894...

ASTRAL S/R Support and Resistance Levels:
Support Levels: These are price points (green line/shade) where a downward trend may be halted due to a concentration of buying interest. Imagine them as a safety net where buyers step in, preventing further decline.
Resistance Levels: Conversely, resistance levels (red line/shade) are where upward trends might stall due to increased selling interest. They act like a ceiling where sellers come in to push prices down.
Breakouts:
Bullish Breakout: When the price moves above resistance, it often indicates strong buying interest and the potential for a continued uptrend. Traders may view this as a signal to buy or hold.
Bearish Breakout: When the price falls below support, it can signal strong selling interest and the potential for a continued downtrend. Traders might see this as a cue to sell or avoid buying.
20 EMA (Exponential Moving Average):
Above 20 EMA(50 EMA): If the stock price is above the 20 EMA, it suggests a potential uptrend or bullish momentum.
Below 20 EMA: If the stock price is below the 20 EMA, it indicates a potential downtrend or bearish momentum.
Trendline: A trendline is a straight line drawn on a chart to represent the general direction of a data point set.
Uptrend Line: Drawn by connecting the lows in an upward trend. Indicates that the price is moving higher over time. Acts as a support level, where prices tend to bounce upward.
Downtrend Line: Drawn by connecting the highs in a downward trend. Indicates that the price is moving lower over time. It acts as a resistance level, where prices tend to drop.
RSI: RSI readings greater than the 70 level are overbought territory, and RSI readings lower than the 30 level are considered oversold territory.
Combining RSI with Support and Resistance:
Support Level: This is a price level where a stock tends to find buying interest, preventing it from falling further. If RSI is showing an oversold condition (below 30) and the price is near or at a strong support level, it could be a good buy signal.
Resistance Level: This is a price level where a stock tends to find selling interest, preventing it from rising further. If RSI is showing an overbought condition (above 70) and the price is near or at a strong resistance level, it could be a signal to sell or short the asset.
Disclaimer:
I am not a SEBI registered. The information provided here is for learning purposes only and should not be interpreted as financial advice. Consider the broader market context and consult with a qualified financial advisor before making investment decisions.

AstralFor falling from high Astral is making a good base with consolidation in range of 30 rs as marked by blue lines. Green line is a Avwap. Price is continuously respecting Avwap. Hereafter as price keeps holding Avwap and bottom range of marked zone there is greater chance of price breaking higher levels. This needs to be further confirmed.
This analysis is just for educational purpose and no recommendations of buying or selling.
