Bajaj Finserv 2 Nov 24 Inv H&S HourlyBajaj Finserv 2 Nov 24 Inv H&S Hourly Potential Opportunity On lower time frame it looks good with decent r:R of 1:3 Bit cautious on the higher time frame until further price unfolds Entry 1777 T1 1825Long03:16by piyushruPublished 2
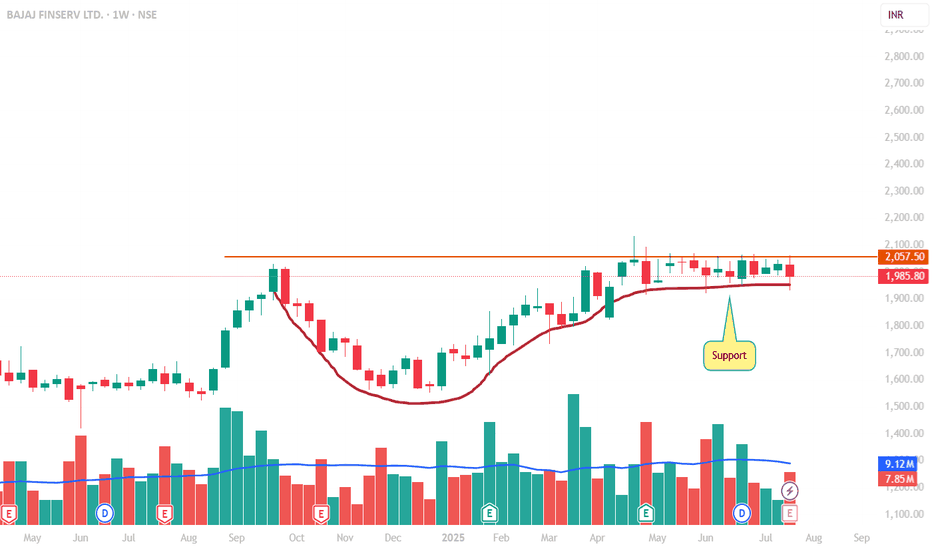
SWING IDEA - BAJAJ FINSERV Bajaj Finserv , a prominent player in financial services, presents a compelling swing trade setup. Reasons are listed below : Symmetrical Triangle Breakout and Retest : The price has recently broken out of a symmetrical triangle pattern and successfully retested, signaling a strong support level. Consolidation Break : A significant 3+ year consolidation phase has been broken, indicating potential for a sustained upward move. 0.618 Fibonacci Support : The price is holding above this key Fibonacci level, suggesting strong buyer interest at current levels. EMA Support on Weekly : Trading above the 50 and 200 EMAs on the weekly timeframe reinforces the bullish sentiment and strengthens support levels. Target - 1900 // 2030 // 2200 Stoploss - weekly close below 1635 DISCLAIMER - Decisions to buy, sell, hold or trade in securities, commodities and other investments involve risk and are best made based on the advice of qualified financial professionals. Any trading in securities or other investments involves a risk of substantial losses. The practice of "Day Trading" involves particularly high risks and can cause you to lose substantial sums of money. Before undertaking any trading program, you should consult a qualified financial professional. Please consider carefully whether such trading is suitable for you in light of your financial condition and ability to bear financial risks. Under no circumstances shall we be liable for any loss or damage you or anyone else incurs as a result of any trading or investment activity that you or anyone else engages in based on any information or material you receive through TradingView or our services. @visionary.growth.insightsLongby Visionary_Growth_InsightsPublished 3
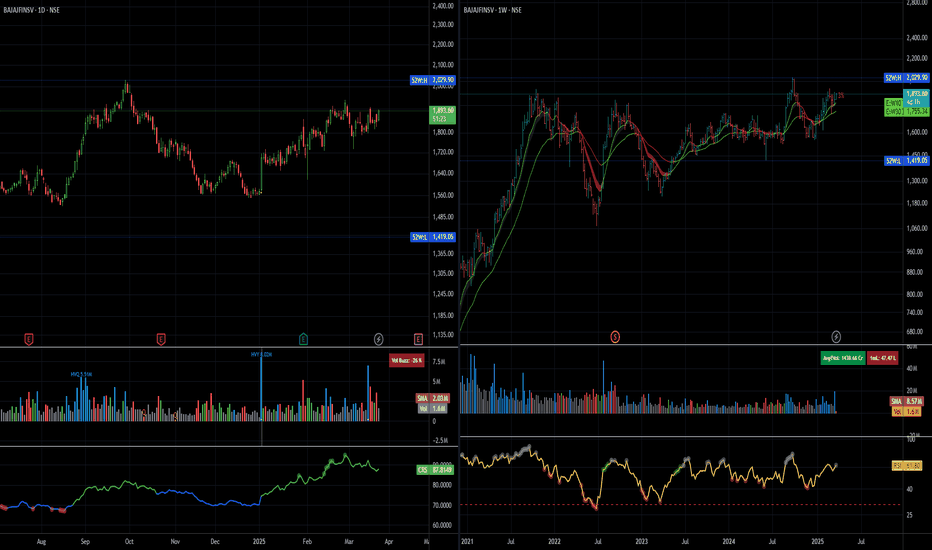
Bajaj Finserv Ltd. - Weekly Chart Analysis1. Symmetrical Triangle Pattern: Bajaj Finserv has been consolidating within a symmetrical triangle pattern over the past few years, showing lower highs and higher lows. This pattern suggests a period of accumulation or consolidation, where both buyers and sellers are competing, leading to a breakout or breakdown. 2. Recent Breakout and Pullback: The price recently broke above the upper boundary of the triangle, indicating a bullish breakout, which was accompanied by significant buying volume. Currently, the price is retesting the breakout level, which may act as a support zone if it holds. 3. Fibonacci Levels and Potential Resistance Zones: The previous high near INR 1,880 (approx.) acts as a critical resistance zone. This level also aligns with the 88.18% Fibonacci retracement level, which may serve as a potential profit-booking zone if the stock moves upward again. If the stock maintains its momentum post-retest, a move toward this resistance could be expected. 4. Volume Profile Analysis: The Volume Profile on the right shows strong support around the INR 1,500-1,600 levels, indicating that a significant volume of shares has been traded within this range. This level may act as a support if the price dips further from the current pullback. 5. Trendline Support and Moving Averages: The long-term upward trendline provides a strong dynamic support level. The 50-week and 200-week moving averages are positioned below the price, indicating a long-term uptrend and offering additional support around INR 1,500. 6. RSI and Momentum Indicators: The Relative Strength Index (RSI) shows a healthy range but is not overbought, suggesting there is room for further upward movement. A crossover in the RSI or any divergence may indicate potential reversals, so keeping an eye on these indicators would be beneficial. 7. Key Levels to Watch: Support: INR 1,500-1,600 (Volume Profile and Moving Average Support), INR 1,730 (current retest level). Resistance: INR 1,880 (previous high and Fibonacci level). Conclusion: The stock is at a critical juncture, currently retesting the breakout level of the symmetrical triangle. If the price sustains above INR 1,730, we could see a bullish continuation toward INR 1,880. However, a breakdown below the trendline or INR 1,500 could invalidate the bullish outlook, potentially leading to further downside. Longby AngshumanSaikiaPublished 3
Bajaj finserv chart analysisBajaj finserv chart analysis on weekly time frame. This stock is about to give multi year breakout. Please follow for more such charts.Longby mystery_indian_TraderPublished 3
Bajaj Finserv - Breakout RetestAfter a very long consolidation and breakout, Now the stock is again at retest point. Looks good for medium term investment. Longby ShubhamTurkiyaPublished 1
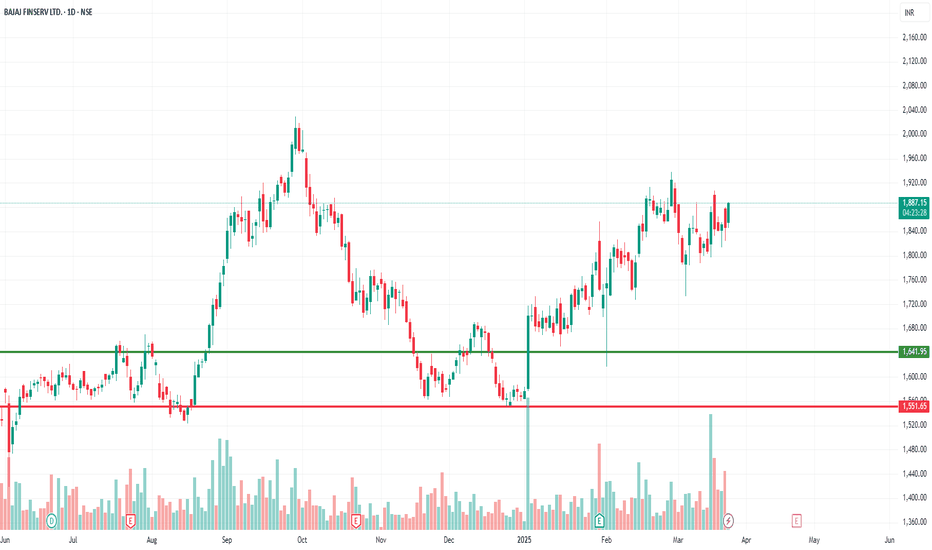
BAJAJ FINSERV S/R Support and Resistance Levels: Support Levels: These are price points (green line/shade) where a downward trend may be halted due to a concentration of buying interest. Imagine them as a safety net where buyers step in, preventing further decline. Resistance Levels: Conversely, resistance levels (red line/shade) are where upward trends might stall due to increased selling interest. They act like a ceiling where sellers come in to push prices down. Breakouts: Bullish Breakout: When the price moves above resistance, it often indicates strong buying interest and the potential for a continued uptrend. Traders may view this as a signal to buy or hold. Bearish Breakout: When the price falls below support, it can signal strong selling interest and the potential for a continued downtrend. Traders might see this as a cue to sell or avoid buying. 20 EMA (Exponential Moving Average): Above 20 EMA(50 EMA): If the stock price is above the 20 EMA, it suggests a potential uptrend or bullish momentum. Below 20 EMA: If the stock price is below the 20 EMA, it indicates a potential downtrend or bearish momentum. Trendline: A trendline is a straight line drawn on a chart to represent the general direction of a data point set. Uptrend Line: Drawn by connecting the lows in an upward trend. Indicates that the price is moving higher over time. Acts as a support level, where prices tend to bounce upward. Downtrend Line: Drawn by connecting the highs in a downward trend. Indicates that the price is moving lower over time. It acts as a resistance level, where prices tend to drop. RSI: RSI readings greater than the 70 level are overbought territory, and RSI readings lower than the 30 level are considered oversold territory. Combining RSI with Support and Resistance: Support Level: This is a price level where a stock tends to find buying interest, preventing it from falling further. If RSI is showing an oversold condition (below 30) and the price is near or at a strong support level, it could be a good buy signal. Resistance Level: This is a price level where a stock tends to find selling interest, preventing it from rising further. If RSI is showing an overbought condition (above 70) and the price is near or at a strong resistance level, it could be a signal to sell or short the asset. Disclaimer: I am not a SEBI registered. The information provided here is for learning purposes only and should not be interpreted as financial advice. Consider the broader market context and consult with a qualified financial advisor before making investment decisions. by zenthoshPublished 0
BAJAJFINSVNSE:BAJAJFINSV One Can enter now! Or Wait for a retest of the trendline(BO)! Or Wait for a better Risk:Reward Ratio! Note : 1. One should go long with a StopLoss, below the Trendline or the Previous Swing Low. 2. Risk :Reward ratio should be minimum 1:2. 3. Plan your trade as per the Money Mangement and Risk Appetite. Disclamier : You are responsible for your profits and loss. The idea shared here is purely for Educational purpose. Follow back, for more ideas and thier notifications on your email. Support and Like incase the idea works for you. Longby CreativeCreatureUpdated 1114
bajaj finserveThe lending business (BAF) is consistently outpacing industry growth, while maintaining impressive profitability metrics. The general insurance business (BAGIC) is also demonstrating healthy profitable growth amid intense competition, while the life Insurance business (BALIC) is navigating through current regulatory changes with some near-term impact on profitability. We believe the group is well positioned to capture the structural growth story across the financial landscape (lending, investing, and protecting) in India over the medium to long term.Longby TradernawabPublished 3
Bajaj finserv multi year breakoutBajaj finserv multi year breakout taret are marked i pic first 2000, 2400 SL keep trailin 3% of low of previous candle Just a view and not a buy/sell advise. educational purpose only Longby Santosh_TambeUpdated 6
Bajaj Finserv Ltd view for Intraday 19th September #BAJAJFINSV Bajaj Finserv Ltd view for Intraday 19th September #BAJAJFINSV Buying may witness above 1905 Support area 1870-1872. Below ignoring buying momentum for intraday Selling may witness below 1872 Resistance area 1900-1905 Above ignoring selling momentum for intraday Charts for Educational purposes only. Please follow strict stop loss and risk reward if you follow the level. Thanks, V Trade PointLongby vichithraPublished 1
BAJAJ FINSERV TRIANGLE PATTERN As we can see, BAJAJ FINSERV was forming a symmetrical triangle pattern on a weekly time frame and has currently broken out of it. We can consider a buy on pullback at around 1835.by Kartik_ElkunchwarPublished 4
BajajFinsv - Cobra Pattern/ Potential UptrendBajaj FInserv Ltd. Good earnings High Trade Quantity Closing above Previous High Close within 52 week Zone P.S. - This actually a FLAG PATTERN. (cobra is for fun) Disclaimer: For educational purpose only. Please do your own research before taking any trades. Happy Trading! Longby SUDHEER-REDDYPublished 2
Bajaj Finserv Ltd on a bullish breakout, volume rising sharply!➡️ Bullish breakout above ₹1,899 with surging volume at 3.078M, signaling strong interestLongby GlobalMarketGuruPublished 0
May be create Long Opportunity1)Price turning sideways after a Up move. Maybe gives indication of 4th wave 2)If this will be the 4th wave then the final 5th is still pending my brother. 3)The three-year trendline that has been in place since 2021 seems to be breaking this time.by kntravi876Published 5
Bajaj Finserve: 1745 Level is the key Bajaj Finserve Key Points: Consolidation of nearly 30 days before the up-move provides a reliable cushion. 1745 works as a support reflecting a confluence of Fib Extension and a short term previous swing high. Check out depicted levels for re-entry/profit booking/ Stop Loss. Longby CKParkhiPublished 0
Bajaj Finserve: 1745 Level is the key Bajaj Finserve Key Points: Consolidation of nearly 30 days before the up-move provides a reliable cushion. 1745 works as a support reflecting a confluence of Fib Extension and a short term previous swing high. Check out depicted levels for re-entry/profit booking/ Stop Loss. Longby CKParkhiPublished 2
BAJAJFINSERVTechnicals: 1) A triangle pattern has formed since Jan'2021. 2) The breakout from that pattern occurred after almost 3.5 years. Please provide ideas if any... ***Disclaimer: Strictly for discussion purposes and not for making decisions on investing in the stockby Prasad_ChenchuPublished 4
BajajFinsv - Breakout on weekly chart👉Strong Breakout Seen on weekly chart 👉Compounded Sales Growth of 3 years 22% 👉Compounded profit growth of 3 years 22% 👉Stock Price CAGR 2% (Value unlocking is due) 👉Good Promoter Group Targets - 2000, 2500, 3000 Wait for retest Happy Investing..Longby StockiistPublished 5
Potential Breakout Opportunity in Bajaj Finserv Ltd. Bajaj Finserv Ltd. is currently forming a classic ascending triangle pattern on the monthly chart, a bullish continuation pattern often signaling a potential breakout. The price has been consolidating within this pattern, making higher lows, and is now approaching the resistance level at around ₹1,925. Key Levels: Support: The lower trendline, which has been acting as a strong support, currently lies near ₹1,600. Resistance: The upper trendline, around ₹1,925, is the critical level to watch for a breakout. Target 1: ₹1,925, where the price is expected to test the resistance. Target 2: ₹2,300, which could be the next significant level if the breakout holds. Indicators: RSI: Currently around 62, indicating momentum is building but not yet overbought, supporting the potential for further upside. Volume: Gradual increase in volume suggests accumulation, which might fuel the breakout. Disclaimer - This is just for education purpose only. Take financial advice from financial advisor before investing.Longby jeet20Published 6
Bajaj FinservThis is the daily chart of Bajaj finserv on DTF, one can keep an eye...by MARKET_SCENARIOPublished 1
Bajaj Finserv: Monthly Ascending Triangle Breakout! Bajaj Finserv: Monthly Ascending Triangle Breakout! 🚀 Current Market Price: 1783 Stop Loss: 1551 Target: 2440 Bajaj Finserv is showing a strong monthly breakout from an ascending triangle pattern, with the highest monthly close since October 1, 2021. A small resistance lies near 1932, and further gains are expected once this level is crossed. Potential for a strong rally ahead! 📉 Risk Management: Keep your stop loss at 1551 to protect your position. 📊 Disclaimer: As a non-SEBI registered analyst, I recommend conducting thorough research or seeking advice from financial professionals before making investment decisions. Exciting times ahead! #MarketAnalysis #BajajFinserv #TechnicalAnalysis #AscendingTriangle #Breakout #InvestmentOpportunitiesLongby satyam15Published 1
POSITIONAL IDEA- BAJAJ FINSERVEPOSITIONAL opportunity in bajaj finserv with 1:6 RR, bounce from fibonicci 61.8% with VCP in symmetrical triangle.Longby RAJDADUpdated 1
Breakout Confirms !NSE:BAJAJFINSV trade at 1755. Support at 1530 Resistance at 1800. When its break resistance level you can watch it next resistance at 1950.Longby thecapitalmarketsPublished 4