BAJAJFINSV trade ideas

Stock For 12 March 21👁 Marked Levels of BAJAJFINSVStock For 12 March 21👁
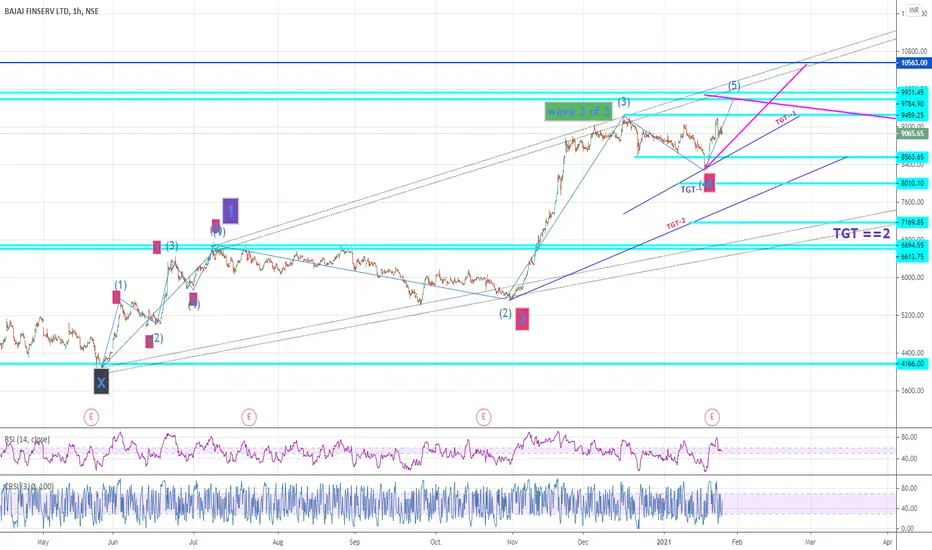
Marked Levels of BAJAJFINSV
Please keep the stock in your watch list & observe the market movement before take your Trades.

BajajFINSV ShortHarmonics with 1.13 FIB level and EW 5 wave impulse sequence is highly likely completed.
RSI Bearish Div
Short with SL as 10400
Tgts are 9650, 9500 and aggressive tgt of 9450

Bajaj finserv target 19000Bajaj finserv breakout all time high ...
1st target 12000, next long term target 19000

BAJAJ FINSERVEBAJAJ FINSERVE, 1 Hour Chart
Break out done,
Can go long for Target 9440 and 9770
Stoploss below 8950
Disclaimer
My Studies are Educational purpose only
CONSULT with your financial advisor before trading or investing

BAJAJFINSVBAJAJFINSV formed a symmetrical Triangle patter, red lines are Targets , trade on ur own Risk and Rewards With Stoploss.
This lever Are for intraday and BTST.


support bounce stock has tested the support 3 times, making lower wicks (clearly showing price rejection) now engulfing 3 bear session, poor selling we have seen while consolidation , price is above 200 MA,


BAJAJFINSV LevelsDaily/weekly
>>1/12
- Flag and poll on daily,
- Saw a good rally from 5-20 nov on upside.
- going sideways/consolidating after the rally
- watch for high lows form up and down side target.
Intraday
>>1/12
- good up move from 6 jan to 8 jan
- 8948 50% Retracement form 6-8 jan rally.
- 9024 38.2 % Retracement - acting as a resistance.
- 8768.5 is 78.6% Retracement form 6-8 Jan up move can act as a target on downside.
- Good Support around 8973.50
- Saw a breakdown in last 1 hr of trading session on 1/12. Expecting the Support Zone break and 8770.70 as 1st short target.


#BAJAJFINSV eyeing 10500-10600#BAJAJFINSV eyeing 10500-11000, which once broken we can see 11500-12000 range on it.
Pick some Dec 10000 Calls @ 100-110 range

Bajajfin { Short 15 m } IB in formation , It has already broke IB in W frame . Now we're just waiting for confirmation in 15 m tf for a intraday trade . Rest is as per chart
Note :-
Entry - At the break of mentioned candle's low/high
Stop Loss -
In a Short Trade, I always use Previous Candle High ( PCH ) as a stop loss while entering the trade. Sometime I might use 15 M tf SL & trade in 30M tf which I'll mention. Vice Versa for long trades
Trailing Stop Loss ( TSL ) - Mostly I trail stop loss by PCH as price falls . I exit as PCH breaks & vice versa
Use of PSAR as TSL :- TSL get's hit in trend following due to noise, In such cases I use PSAR to be in trend & exit if PSAR direction change
You can use any one of above mentioned or your own way to manage risk
Time Frame :- I take ~ 90% of my intraday trades in 15m tf. Where my analysis might come from higher frames like W , D or 1hr chart pattern which will be mentioned.
Target :- I do set target line based on support / resistance slightly above/ below it . Please pay attention to it

BAJAJFINSERVI'm not an expert I'm just sharing my views on BAJAJFINSERV for next trading day
I'm not responsible for any profit or loss this is not a recommendation.

BAJAJ FINSERVI'm not an expert I'm just sharing my views on BAJAJ FINSERV for next trading day
I'm not responsible for any profit or loss this is not a recommendation.


BAJAJFINSV 200 EMA BREAKOUTIts ready to give a second breakout. Its taking support of 50 EMA and have touched 200 EMA.


