Short Sell BajajHindAfter breaking the low of 27 and closes the daily candle below this level.Sell it with the targets of 23.5 and 2nd target of 20.2 with a stoploss of around 2 rs.
BAJAJHIND trade ideas

SugarComing back to this idea, sugar sector under radar with the all the news flowing in, i think this sector should have a more free hands from the govt sooner.

BajajHind Keep in RadarPositional Trade
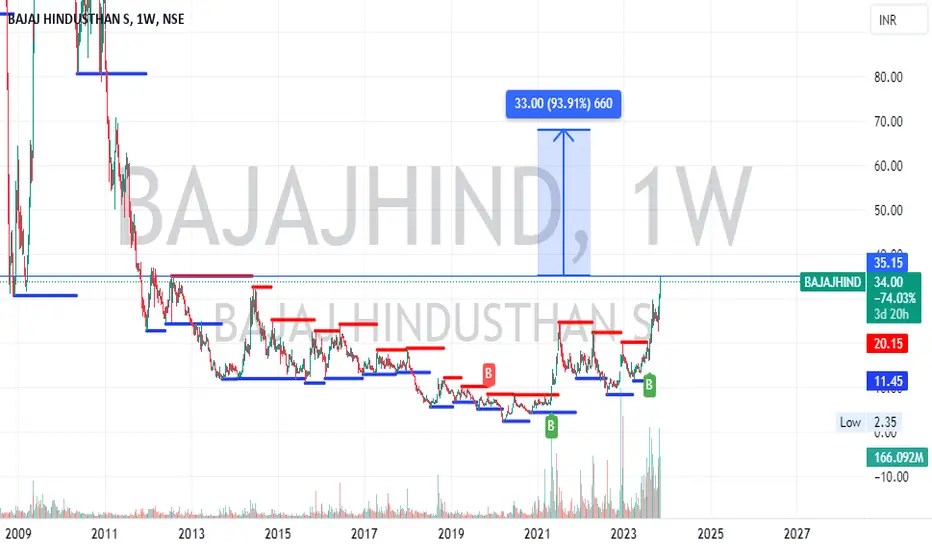
BajajHind Looks Good ABOVE 35
SL 21.80
Target 51.60
Hold a few Weeks
Please consult your financial advisor before investing
All research is for educational purposes only.
Volatility & Volume Contraction
Trading above Key EMAs

Bajaj Hindusthan Sugar Limited (Daily Chart)Bajaj Hindusthan Sugar Limited forms pole & flag pattern.
Above 33.40, it seems good for uptrend.
Stoploss should be 31.50
Disclaimer : I’m not a registered analyst, please do proper research before taking trade.

Bajaj Hind Weekly ChartResistance @ 35.5
Volume Growth
Darvas boxes are a fairly simple indicator created by drawing a line along lows and highs. As you update the highs and lows over time, you will see rising boxes or falling boxes. Darvas box theory suggests only trading rising boxes and using the highs of the boxes that are breached to update the stop-loss orders.
BAJAJHINDNSE:BAJAJHIND
One Can Enter Now !
Or Wait for Retest of the Trendline (BO) !
Or wait For better R:R ratio !
Note :
1.One Can Go long with a Strict SL below the Trendline or Swing Low.
2. R:R ratio should be 1 :2 minimum
3. Plan as per your RISK appetite and Money Management.
Disclaimer : You are responsible for your Profits and loss, Shared for Educational purpose

Head & Shoulders PatternHere I have Published Idea for head & shoulders pattern, You can Take the Position and fix the second target


BaJahind Long for 100% gainChart is self explanatory. Please follow the price action & take the trade as per your appetite.
The information provided here is only for educational purpose. The information provided here is not intended to be any kind of financial advice, investment advice, and trading advice. Investment in stock market is very risky and trading stocks, options and other securities involve risk. The risk of loss in stock market can be substantial. Moreover, I am not a SEBI registered analyst, so before taking any decision or before investing in any Share consult your financial advisor and also do your analysis and research.
Request your support and engagement by liking and commenting & follow to provide encouragement.

ADD THIS TO YOUR INVESTMENT PORTFOLIO!!!
Price has confirmed an Uptrend after violating a Monthly Supply and now is reacting to a Quarterly Demand which should take around a years time to achieve the benchmark of 4:1, the exit is tricky and if not exited @ given target profits may decline rapidly.
This trade will help u increase your savings, as its gonna take a years time due to Price coming from a Quarterly Demand!!!
ENJOY THE RIDE!!!

BUY BAJAJ HINDUSTHAN SUGAR Buy at 18
Sell at 20 24 30 35
Exit below 14 on closing basis
Enter for Immediate profits (Ethanol blending news)
Book profits accordingly.

BAJAJ HINDUSTAN SUGAR LTD. BUYChota Stock Bady Kamai......
Strong Momentum RSI Above 60 on Daily, Weekly, Monthly Basis.....Bollinger Band very Tight Squeez from Jun 22 which is blast...on Daily Basis...With High Volume.Cup Pattern on Daily n Weekly Basis....
Buy: CMP, SL:13.50, Upside possibility : 22,24,32 on long term basis....
Good Luck & Good Trading....

Parallel channel THIS STOCK IS TRADE ON PARALLEL CHANNEL ENTRY AT 15 AND EXIT AT 18 TO 19 .FOR STOPLOSS 14
DISCLAIMER:It is fully educational purpose only.
You take trade based on your wish


Cup and handle patternWeekly cup and handle pattern. Target levels are as shown in chart.
Only for medium term investment perpouse.

Bajaj Hindustan sugar harmonic pattern Bajaj Hindustan sugar BULLISH HARMONIC monthly time frame, 1st i wanna tell you(worst fundamental ,heavy depth, and recently sbi file case ) risk trade
If u want to consider then take entry 7.50 near here is heavy resistance and also bullish harmonic pattern complete.
## always take entry on retest ##
∆ Buy price -7.50
∆ SL- 6
∆target- 12

BAJAJHINDCmp... 8.95...moving in downward parallel channel... its near to its demand zone...may bounce back from there???? Keep watch on it....may give good upward movement in comming days.
I m not sebi regt analyst or advisor.
Post is only for an educational purpose.
Do ur own diligence or check with ur financial advisor before taking any position.

breakout after long term consolidation high demand of ethanol.A multi-bagger with an SL of 10 can be added for the target of 115 and above.

Expected Buy Zone BAJAJ HINDUSTAN SUGAR Buy@(12-14.25) DISCLAIMER: There is no guarantee of profits or no exceptions from losses.
The technical analysis provided on the chart is solely the personal views of my research.
You are advised to rely on your own judgments while investing/Trading decisions.
Past performance is not an indicator of future returns. Investment is subject to market risks.
Seek help of your financial advisors before investing/trading.


Bajaj Hindustan - BuyBajaj Hindustan above 11.5 for target of 14 and 17.5 with SL of 10 for short to medium term.

