Ascending Triangle busted- Bajaj finance 📉 Bajaj Finance Breakdown Alert 🚨
Ascending Triangle busted!
Bearish RSI Divergence + Trendline Break = Trouble brewing.
High volume node - ₹920 could cap any retest.
Next support zone?
👀 ₹840–₹800 range looks like the battleground!
BAJFINANCE trade ideas

Bajaj Finance Long_Support @ 20 DEMABajaj Finance Long:
- Price takes support at 20 DEMA
- Rebound from the trend line
- Enter long when the price are favorable in the lower timeframe
- SL: Close below 20 DEMA

Bajaj Fin 30% Swing Trade Bajaj Swing Trade
Entry - 8740/-
Target - 30%
Please DYOR before investing.

BAJAJ FINANCE LTD at Best Support !!This is the 4 hour Chart of BAJFINANCE.
BAJFINANCE having a good support at 880-900 range.
BAJFINANCE is currently trading within an ascending channel pattern, indicating a structure of higher highs and higher lows, which reflects a sustained uptrend.
If this level is sustain, then we may see higher prices again BAJFINANCE.
Thank You !!

BAJAJ FINANCE📈 Trade Setup
Parameter Value
Entry 878
Stop Loss (SL) 860
Risk 18
Target 1016
Reward 138
Risk:Reward (RR) 7.7
Last High 978
Last Low 840
✅ Trade Interpretation
Entry at 878 sits inside Daily & Intraday Demand Zone (878–860) → good support.
Stop Loss at 860 is below demand zone → protects against breakdown.
Target 1016 is conservative and achievable based on previous price behavior and a breakout above the last high of 978.
RR of 7.7 is excellent—well above minimum acceptable trading standards (typically >2.0).
📌 Key Insights:
All MTFs indicate bullish trend and stacked demand zones.
Entry plan is logical with favorable risk-reward.
Ideal setup for swing trade or short-term positional if overall market sentiment is neutral to positive.
🔍 Multi-Timeframe (MTF) Analysis Overview
🔸 Higher Time Frame (HTF)
Trend: UP across Yearly, Half-Yearly, and Quarterly
Support Zones:
Yearly & Half-Yearly: 782–642 (Avg: 712)
Quarterly: 820–666 (Avg: 743)
HTF Avg Demand Zone: 795–650 (Avg: 722) → Strong Long-Term Support
🔸 Medium Time Frame (MTF)
Trend: UP across Monthly, Weekly, Daily
Demand Zones:
Monthly: 825–778 (Avg: 802)
Weekly: 892–846 (Avg: 869)
Daily: 878–860 (Avg: 869)
MTF Avg: 691 (This seems like a placeholder or a misentry since zones are in 800+ range)
🔸 Intraday Time Frame (ITF)
Trend: UP across 240M, 180M, 60M
Demand Zone (common): 878–860 (Avg: 869)
ITF Avg: 691 (Again, this value doesn't match the actual average; likely a placeholder)

Bajaj finance for Swing Bajaj finance is good looking for swing,
Small sl, and good support,
Add in your watchlist.

BAJAJ FINANCE 's Key Resistance Zone This is 4 hour chart of BAJAJ FINANCE
BAJAJ FINANCE having good Resistance at 9800 and 10200 range.
If this level is sustain , then we may see lower prices in BAJAJ FINANCE.
Thank You !!

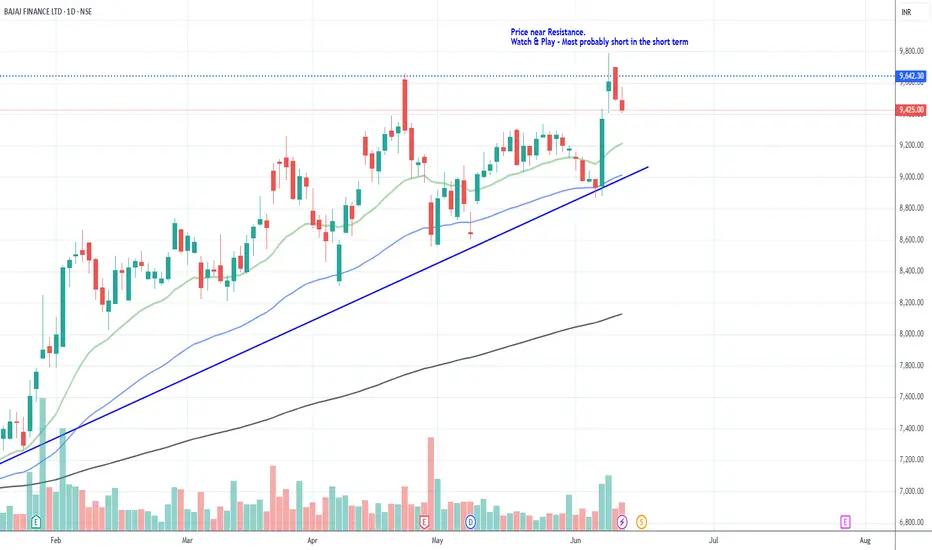
Bajaj Finance_Neutral to Short_Short termPrice near Resistance.
Watch & Play - Most probably short in the short term
#BAJFINANCE - Pivot is 9169.25 | Target 9732.25 or 8606.25?Date: 28-05-25
#BAJFINANCE - Pivot point is 9169.25
#BAJFINANCE Upside Targets:
Target 1: 9544.40
Target 2: 9732.25
Target 3: 9943.38
Target 4: 10154.50
#BAJFINANCE Downside Targets:
Target 1: 8794.80
Target 2: 8606.25
Target 3: 8395.13
Target 4: 8184.00
Support: 8983.36
Resistance: 9356.55


BAJAJ FINANCE is looking strong for the weekBAJAJ FINANCE is gearingup towords our target for coming week, it shows all retest and ready to blast, so lets see

12 monthCandles with a 12-month duration are uniquely crafted to burn slowly and steadily over the course of an entire year. These are not ordinary candles; they are long-lasting, high-quality pieces designed to serve both a functional and symbolic purpose. Often used in spiritual, religious, or ceremonial contexts, these year-long candles are made from premium wax blends that ensure even burning and minimal residue. The extended burn time makes them ideal for marking long-term commitments, setting intentions for the year ahead, or commemorating significant milestones.
A candle that lasts for 12 months can be a powerful visual reminder of a goal, prayer, or meditation practice. Many people use them as a tool for mindfulness, lighting them during daily rituals or weekly reflections. Because of their longevity, they are often associated with endurance, patience, and stability—qualities that are especially meaningful in today’s fast-paced world.

Bajaj Finance Sell sideBaj finace sell side supply zone, breach main support , price going down, play with PUT option 8400 PE

Bajajfinance holding periods decades#bajfinance will break out of this two year triangle, has a huge potential for long run of becoming blue-chip stock,

BajFinanace at crucial junction(make or break)Observations:
Rising Wedge Pattern:
The stock is trading within a rising wedge, a bearish pattern indicating a potential reversal or breakdown.
Currently, price is at the lower trendline of the wedge — a crucial support zone.
Bearish Candlestick:
A strong red candle has formed, suggesting selling pressure.
It’s testing the wedge’s lower support and very close to breaking down.
Volume:
Volume seems to be rising on red candles (selling), suggesting stronger bearish conviction.
Support Levels Below:
Immediate support: ₹8,613.50 (blue horizontal line).
If it breaks, next key levels are:
₹7,806.25
₹7,024.90
₹6,753.30
Potential Price Action Scenarios:
1. Bearish Breakdown (High Probability):
If the price breaks below ₹8,613.50 with strong volume, expect a drop toward ₹7,800 or lower.
This would confirm the breakdown of the rising wedge pattern.
2. Support Bounce (Low Probability):
If the price finds support exactly at the trendline and ₹8,613.50, a short-term bounce toward ₹8,800–₹9,000 is possible.
However, the upside looks limited due to the pattern.
Conclusion:
⚠️ Caution is advised: The chart structure and volume behavior suggest that a breakdown is likely.
A daily close below ₹8,613 would confirm the bearish move.
Use a stop-loss if you're holding long positions.

A Triangle Pattern In BajFinance (Elliott Wave)A Triangle Pattern has appeared in BajFinance
(1) It is an Elliott Wave Patter where we Enter on Break Of B-D Trendline
(2) Our Stop is Below the E wave
(3) Accuracy of this Pattern is High
(4) we Might have Low Risk to Reward Ratio Coz it is a Breakout Pattern But Accuracy Compensates For the Same

BAJFINANCENSE:BAJFINANCE
One Can Enter Now ! Or Wait for Retest of the Trendline (BO).
Note :
1.One Can Go long with a Strict SL below the Trendline or Swing Low of Daily Candle.
2. Close, should be good and Clean.
3. R:R ratio should be 1 :2 minimum
4. Plan as per your RISK appetite
Disclaimer : You are responsible for your Profits and loss, Shared for Educational purpose

bajaj finance on monthly breakout chart looks promising a multymonths break out on bajaj finance despite of this global crunch , chart looks promosing for new investment as well as holding existing

Bajaj financeBajaj finance is mantaining strong in this market. Positive signs fr an upmove with bullish structure.


BAJFINANCE Breakout – Holding Strong!
The recent breakout in Bajaj Finance Ltd (BAJFINANCE) looks promising. 📈
Is this the end of BAJFINANCE 42 month long consolidation?
While the broader market is in a correction phase, this stock is showing resilience—for now.
🔎 Important Note: During market crashes or prolonged corrections, strong stocks tend to correct later and with a smaller percentage decline.
⚠️ This is NOT a buy recommendation. Please consult your financial adviser before making any investment decisions.
