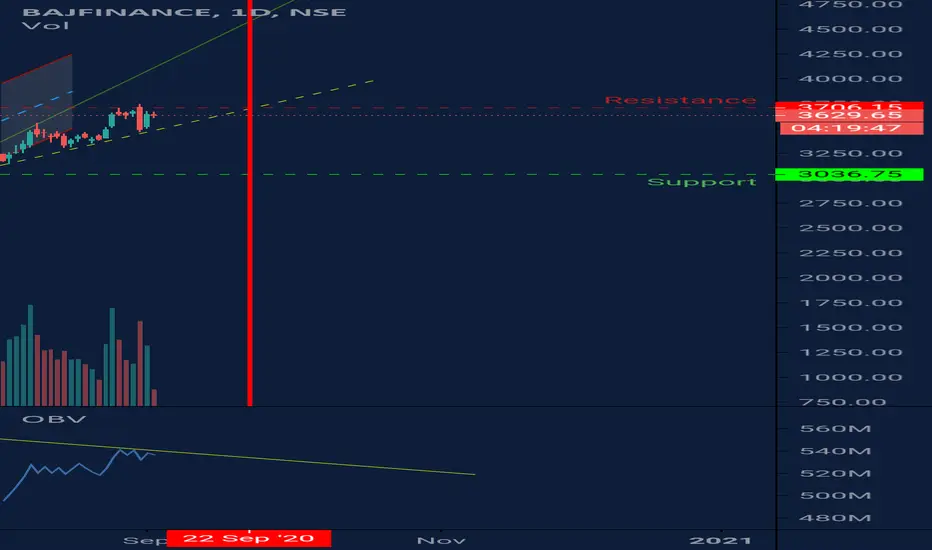
BajajFinance : RetracementClearly We can see downtrend in BajajFinance, it should Retrace Till Dotted Green line, that is as earlier 50% retracement, while one can see pause & pullback at Demand & Supply Zones.
After retracement it should continue its downtrend.
BAJFINANCE trade ideas


R-0219 Stock Option Buy BAJFINANCE OCT PE 3000.00 @125-129 SShort Term Stock Option Buy BAJFINANCE OCT PE 3000.00 @125-129 SL 92 TGT 195
MACD cross over + TK cross over on bearish side + break support 3170 next support 2850 so GO SHORT


21) LOOKING BULLISH @BUY AT - 3565 , S L - 3384 , T P - 3840Long term survival is a more important thing to consider in trading than short term profitability


BAJFINANCE Trade setup for 14 sept. 2020Trade on breakout direction for min. Target of 1% of price from breakout level.


Wait for the upside break above 520The stock yesterday got a recovery. But this doesn't mean that the stock has reversed its trend if the stock sustains above the important level 520 the the stock will be in positive trend , below the level of 430 the stock will be in negative trend . So , have patience , watch the important levels and make money , Any queries or suggestions - Comment or join the conversation

Bajaj Finance - Complete Breakdown Of ChartHi Traders,
As we analyse the daily chart, price is in an uptrend because it is trading above the 50SMA. The key levels are at 3518 (Green) , 3606.60 (Yellow) and the golden zone between 3446.35 - 3374.70 respectively. We can see that price has found support at the golden zone and has tested our resistance level at 3518. Since price found support at the golden zone, breaking of the recent high(3749.85) is unlikely. So we can conclude that this stock is in its exhaustion stage and the present uptrend will end soon. If the price close below 3272.75 (Red), this marks the end of current uptrend.
Now we will look into the hourly chart for short term opportunities. The hourly chart is below the 50 SMA indicating a downtrend but since the higher timeframe is showing uptrend, it is advisable to take buy positions. Short term buys can be done if it breaks the hourly trendline and must be cautious when price tests the above mentioned key levels. Intraday trades can be planned based on price action at the above mentioned levels.
Note:- This analysis can be used for short term and medium term analysis. We need to breakdown the weekly chart for long term investments.
If u have any suggestion on which counter u need an analysis, please comment below.
Pls like and follow for more.
Happy Trading............

Baj finance good long candidateBajaj finance bullish gartley formation
prz in range 3395 to 3369
pattern violation below 3350
upside open targets


bajaj finance 1 day chart made rising wedge (education idea )bajaj finance 1 day chart made rising wedge (education idea )

Bajaj Finance Reversal possibilityComing close to resistance, few days back already reversed after touching resistance.
Personally, I will be cautious.