BDL - MY PICK - No AdviceBDL - the defence sector stock, is in strong uptrend. it corrrected slightly to about 14% and has also grabbed liduidity and had taken support with 2 time the delivery volumes. Its now ready for new high with strong momentum
BDL trade ideas


Pending Gap On Weekly Timefram, Buy Or Sell ? #defense #bdlIn this chart bdl is is going to fill the gap it made on weekly timeframe to collect more liquidity to bounce back up side. what should you do, buy or sell ? #bdl #defensestock #cochinship

Bharat Dyanamics Ltd view for Intraday 26th May #BDL Bharat Dyanamics Ltd view for Intraday 26th May #BDL
Resistance 1920 Watching above 1925 for upside momentum.
Support area 1880 Below 1900 ignoring upside momentum for intraday
Watching below 1878 for downside movement...
Above 1900 ignoring downside move for intraday
Charts for Educational purposes only.
Please follow strict stop loss and risk reward if you follow the level.
Thanks,
V Trade Point

BDL 1562 looks good for momentum with SL of 1375BDL 1562 looks good for momentum with SL of 1375........
shortterm momentum

Stock: BDL (Bharat Dynamics Ltd) – Positional Trade Setup📈 Chart Observations (1D timeframe):
Price: ₹1,399.30
Recent Highs: The stock attempted a breakout above the ₹1,400–1,430 zone, which has acted as strong resistance since mid-2024.
Previous Breakout Zone: The big rally from around ₹800 to ₹1,800 happened in early 2024, followed by a long consolidation.
Structure: A cup and handle pattern is potentially forming, with the handle nearing completion.
Volume (not visible): Should be checked for confirmation if you plan to enter.
✅ Positional Trade Setup
Entry Zone:
✅ Aggressive: ₹1,395–₹1,405 (current levels)
✅ Safe Entry: On a daily close above ₹1,430 with good volume
Targets:
🎯 Target 1: ₹1,520
🎯 Target 2: ₹1,650
🎯 Target 3 (long-term): ₹1,800+
Stop-Loss:
🛑 SL: ₹1,310 (below the recent swing low & handle support)
Holding Period:
📅 4–8 weeks for initial targets
Can trail SL for longer trend holding if ₹1,800+ is breached
⚠️ Key Levels to Watch:
Support: ₹1,310 | ₹1,250
Resistance: ₹1,430 | ₹1,520 | ₹1,650

BDL: DOUBLE BOTTOM BREAKOUTThe Double Bottom pattern is a bullish reversal chart pattern that signals the potential end of a downtrend and the beginning of an uptrend. It consists of two consecutive troughs (lows) at roughly the same level, separated by a peak. The pattern resembles the letter "W."
Key Features:
Two Lows: Nearly equal in price, indicating strong support.
Neckline: The peak between the two lows acts as a resistance level.
Breakout: A bullish signal is confirmed when the price breaks above the neckline with strong volume.
Price Target: The expected upward movement is typically equal to the distance between the lows and the neckline.
Double Bottom pattern in Bharat Dynamics Ltd. (BDL) is confirmed, with both lows near ₹888 and a breakout above the ₹1,345 neckline, the price projection suggests a potential upside. The expected price target can be estimated by measuring the distance between the neckline and the lows, which is ₹1,345 - ₹888 = ₹457. Adding this to the breakout point, the projected price target would be ₹1,345 + ₹457 = ₹1,802. If the stock sustains above ₹1,345 with strong volume, it could gain further bullish momentum, potentially reaching ₹1,800 or higher in the medium term.


BHARAT DYNAMICS | LONG | POSITIONALBHARAT DYNAMICS has recently been in the news for Govt. order purchases.
The stock has been exhibiting Bullish price action since the beginning of 2025.
As you can see, the price tested the 50% zone of the last correction since July 2024 and after rejecting that level, it has given its first Higher Low.
This would be a good entry zone for Best Risk to Reward.
Those looking to Hold it Long Term can aim for a First Target of 1685 price.
SL would be 1781

swing trade long positionstock is showing reversal
it has formed W pattern
entry 1300
target 1720
sl 1080
R:R ratio 1.9

STOCK FOR SWING BHARAT DYNAMICS LTD
TF 1W
UPPER SIDE 1300 LEVEL TAKE A ENTRY WHEN THIS LEVEL BREAK
TARGET-1455-1600-1670-1700++
STOPLOSS-1000
Bharat Dynamics (BDL), is a Government of India Enterprise. It is engaged in the manufacturing of guided missiles and allied defence equipments
(ANYONE WANT TO SWING TRADING CALLS THEN DM ME)

Stock in Focus: BDL📈 Stock in Focus: BDL
🔍 Technical Setup:
Buy Above: ₹1,286
Stop Loss: ₹1,222
52WH Target: ~29% potential upside! 🚀
Key Indicators:
Strong breakout from consolidation.
Rising RS line and increased volume indicate bullish momentum.
📊 Plan: Watch for sustained moves above 10WEMA for confirmation.
#BDL #StockMarket #TechnicalAnalysis #BreakoutStocks

BDL - An update and a VSA Learning ExerciseThis is just a learning exercise. We had anticipated a good move from this stock. However, 1230 was the trigger point for the Up move Now let us do a bar to bar analysis.
Refer the box marked “A”. We can see there was a sideways move or a consolidation happening. We can see the prices clustering together and the volume became low. It Indicated accumulation going on.
Refer to the bar marked “B”. It is an up bar with increased volume. This bar was an indication that things are about to change.
Refer to the Bar marked “C”. The next bar is a wide spread bar going past the trigger point, ending near the top. Also, we can see the volume increased volume indicating a high probable Breakout.
And today's bar (marked “D’) opened up above the previous close. The bar did see some selling, but finally it overcame the selling and closed up. Of course, the spread was not, the spread was narrow indicating selling pressure still present.
We can see the stock has started its up move and it is all supported by increased volume and the momentum. The price action momentum is also driven by volume and we can see increased relative strength. All that support further up move and the first obstacle we could see would be 1365, where we may see some more consolidation before further up move. This whole exercise is just for learning purpose.

BHARAT DYNAMICS 1 d chartHad given strong breakout with volume .
Buying seen in last few days .
Resistance broken .
Price crossing last week's high
Increasing RSI > 60.

BDL - On the Recovery ModeCurrently we can see many of stocks which had substantially come down from their highs are in the recovery mode. We will be covering some of these in the coming few days. We will start with the first one which is Bharat Dynamics Ltd.
The stock saw a bearish down move of more than 15% and ended up below the 200 DMA. Now it looks like it is on the recovery mode. It has crossed above the 200 DMA and the short-term moving averages. Also, it has broken the supply line as well. We can see good volume support coming in. All key parameters like the relative strength, money flow, buying pressure and the volume adjusted momentum all seem to be favouring the up move. The stocks saw a quick up move, then it saw a small consolidation and has started resuming the up move. We can see a break of structure on the daily time frame. Now the stock is making a higher high and higher low structure and is likely to continue the up move. We could see a substantial up move and the stock could test the previous high of 1770. Of course, the overall market situation should also support the move. However, the downside is now capped and we can see more upside only.

Long Term Investment onlyBDL LTP: 950
Targets: 1300, 1400, 1500, 1600, 1700 🤞🏻🤞🏻
May add on dips till 800.
For investors with a long-term perspective and the ability to add on dips or hold calmly.
Time Frame: 3 to 8 months 🤞🏻
Trade as per your risk management and investment plan.


BHARAT DYNAMICS LTD S/RSupport and Resistance Levels:
Support Levels: These are price points (green line/shade) where a downward trend may be halted due to a concentration of buying interest. Imagine them as a safety net where buyers step in, preventing further decline.
Resistance Levels: Conversely, resistance levels (red line/shade) are where upward trends might stall due to increased selling interest. They act like a ceiling where sellers come in to push prices down.
Breakouts:
Bullish Breakout: When the price moves above resistance, it often indicates strong buying interest and the potential for a continued uptrend. Traders may view this as a signal to buy or hold.
Bearish Breakout: When the price falls below support, it can signal strong selling interest and the potential for a continued downtrend. Traders might see this as a cue to sell or avoid buying.
20 EMA (Exponential Moving Average):
Above 20 EMA(50 EMA): If the stock price is above the 20 EMA, it suggests a potential uptrend or bullish momentum.
Below 20 EMA: If the stock price is below the 20 EMA, it indicates a potential downtrend or bearish momentum.
Trendline: A trendline is a straight line drawn on a chart to represent the general direction of a data point set.
Uptrend Line: Drawn by connecting the lows in an upward trend. Indicates that the price is moving higher over time. Acts as a support level, where prices tend to bounce upward.
Downtrend Line: Drawn by connecting the highs in a downward trend. Indicates that the price is moving lower over time. It acts as a resistance level, where prices tend to drop.
RSI: RSI readings greater than the 70 level are overbought territory, and RSI readings lower than the 30 level are considered oversold territory.
Combining RSI with Support and Resistance:
Support Level: This is a price level where a stock tends to find buying interest, preventing it from falling further. If RSI is showing an oversold condition (below 30) and the price is near or at a strong support level, it could be a good buy signal.
Resistance Level: This is a price level where a stock tends to find selling interest, preventing it from rising further. If RSI is showing an overbought condition (above 70) and the price is near or at a strong resistance level, it could be a signal to sell or short the asset.
Disclaimer:
I am not a SEBI registered. The information provided here is for learning purposes only and should not be interpreted as financial advice. Consider the broader market context and consult with a qualified financial advisor before making investment decisions.

BDL Short-Term Long Trade on 15m Time Frame: TP4 ReachedWe initiated a short-term long trade setup in Bharat Dynamics LTD (BDL) on the 8th of October at 9:45 am, entering at 1114.45 based on the bullish signal from the Risological Swing Trader. The price action was strong, and we successfully reached TP4 (1225.90) by the 11th of October at 9:15 am.
Target Points Achieved:
TP 1: 1135.70
TP 2: 1170.15
TP 3: 1204.60
TP 4: 1225.90
Stop Loss (SL): 1097.20
This trade exemplifies the power of the Risological Swing Trader in identifying profitable setups and executing with precision. We’ll continue leveraging this strategy for future market moves.

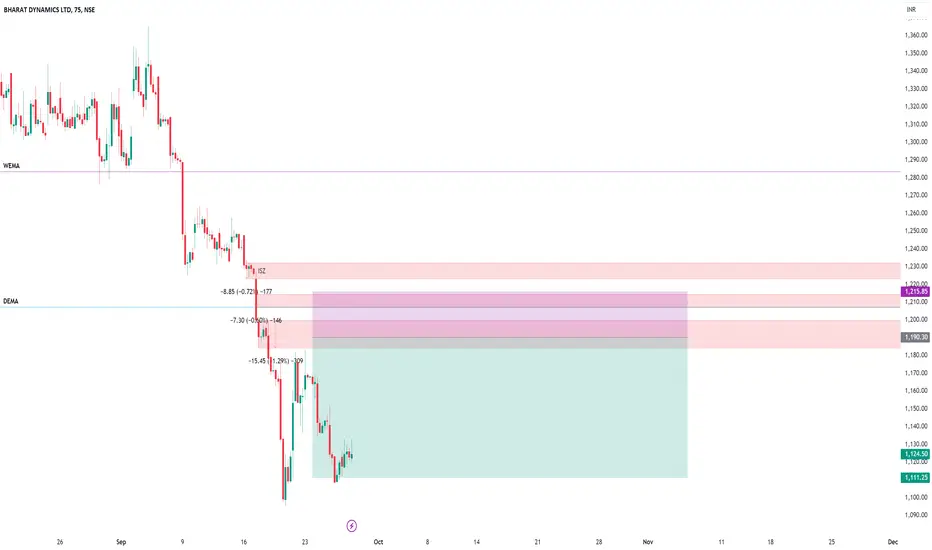
Stock Looking good : Bharat Dynamic Ltd- #Trading new strong Demand zone
- Seller's Exhaustion
- Respecting Falling Trendline
📌Keep an eye either on
- #breakout of trendline
- #Reversal sign @ Demand zone
If you found this chart valuable, do Follow - Like & Comment ❣️
Telegram for frequent updates..👇
@stockgrove

Potential Buying zone in BDLBDL is nearing it's support around 1100-1200.
One's missed the rally can add at these levels.
There's a strong supporting trend line. Could be the Next Best Opportunity to Invest or Swing.
Let the price become Bullish around support, then consider for Swing.
KEEP AN EYE OUT AND DON'T MISS THE OPPORTUNITY

Bharat Dynamics BDL Short Setup on 1D Daily TF on RisologialBharat Dynamics BDL Short Setup on 1D Daily TF on Risologial
After 125% upside rally, BDL has given signs of a possible SHORT trade.
The BDL price is crossing under the Risological trend line, and if we see a red candle today, it is a sign of a good short trade.
Once the trade is confirmed, the Risological swing trading indicator will set the Entry, stoploss and profit targets for this trade.
I will update on this trade post 3:30 closing.
Take care.
Namaste!
