Bharti Airtel ready for big move Bharati Airtel ready for Breakout. It's consolidating in triangle pattern. It can give a big move on either direction in next couple of days.
BHARTIARTL trade ideas

FOR SWING TRADEBHARTIARTL is ready to blast
1WEEK TF
ENTRY- 1640
SL -1500
TARGET- 1690-1710-1740+++
Bharti Airtel Ltd is one of the world’s leading providers of telecommunication services with presence in 18 countries representing India, Sri
Lanka, 14 countries in Africa.

BHARTI | LONG | BTSTBharti Airtel is breaking out of low Volatility compression and has shot up today breaking out of the Weekly Pivot in the first hour of trading.
Long BTST position can be taken for a target to 1638 levels.
If Bharti closes today with an Open = High type daily candle, then the position can be held till 1662 levels.

Bharati Airtel Ltd view for Intraday 5nd jan #BHARTIARTL
Bharati Airtel Ltd view for Intraday 5nd jan #BHARTIARTL
Resistance 1600 Watching above 1603 for upside movement...
Support area 1570 Below 1580 ignoring upside momentum for intraday
Support 1570 Watching below 1568 or downside movement...
Resistance area 1600
Above 1580-1585 ignoring downside move for intraday
Charts for Educational purposes only.
Please follow strict stop loss and risk reward if you follow the level.
Thanks,

POV: BHARTIARTL - Breakout of Descending Triangle PatternPOV: BHARTIARTL - Breakout of Descending Triangle Pattern
1️⃣ Breakout:
A neat and clear breakout of the **Descending Triangle Pattern**, confirmed by high volume, signals strength.
2️⃣ Trend & Momentum:
On the daily timeframe, both trend and momentum are in positive sync, adding confidence to the breakout.
3️⃣ Concerns:
- On the weekly timeframe, the trend is positive, but momentum is still improving, suggesting the journey to the target could be bumpy.
- Range expansion indicates waiting for a pullback is ideal. However, with the Point of Action (POA) around 75 points away, my plan is to:
- Take half an entry at the breakout of the current candle.
- Add the other half at the pullback level, if the opportunity arises.
Disclaimer:
For educational purposes only, not financial advice.
#NiVYAMi

Bharti Airtel Stock chart for the year 2025According to our analysis, in the year 2025 the Bharti Airtel Stock is likely to fall from the second week of March 2025 to Mid of July 2025 and then bounce back. The Market Timing plays a crucial role to invest in the stocks for the optimal results.
This is only for the educational purposes.

Go Long on Bharti Airtel - Target 1780.00Go Long on Bharti Airtel. Accumulate Bharti Airtel in the range of 1550 - 1590 with a strict stop loss of 1420. Short term Time Frame all show oversold territory and Long term Daily chart also show over sold. There was strong accumulation in the stock on 29th November where stock had run 100 Rs. 29th November Open - 1551 High - 1650. All the time frame including Daily and Weekly have made their respective lows. Our Expectation is the Script should retest the highs of Sep 28 1780.00. We advice to go long on Bharti Airtel.

Bharti Airtel Swing TradeHello,
Trend-Based Analysis. Buy the Dips, Sell The Rallies, Also Following the Trend. Let's see where the Price Action takes us, Riding the wave. Potential trade setups based on trend momentum.
Technical analysis based on trend identification and momentum, Looking for high-probability setups within the prevailing trend.
Analyzing the current market trend and potential future price movement. Focusing on risk management and reward-to-risk ratios.
Details is Mentioned in Chart, Read carefully.. .

Bharti Airtel | Short | STBT | SwingBharti Airtel is weak.
Monthly Pivot, Weekly Pivot and Daily Pivot have been rejected.
A short position can be taken once price closes below 1566.
Short side first target - 1545

BHARTIAIRTEL Delviery or Options buyBharti has given a good break out and retraced back..SO if it takes out the previous days high get in...and ride it to the stoploss mentioned on the chart..which stoploss u take is up to u..

Time To Buy Airtel...?Airtel has reversed its downward trend, having previously broken the resistance level of 1605 rupees. It is currently attempting to retest this resistance level. We can consider taking a long position from this point, targeting a gain of 7 to 8%.

BIG CORRECTION AFTER A LONG TIME IS DONE - BHARTI AIRTEL LTDEverything is pretty much explained in the picture itself.
I am Abhishek Srivastava | SEBI-Certified Research and Equity Derivative Analyst from Delhi with 4+ years of experience.
I focus on simplifying equity markets through technical analysis. On Trading View, I share easy-to-understand insights to help traders and investors make better decisions.
Kindly check my older shared stock results on my profile to make a firm decision to invest in this.
For any query kindly dm.
Thank you and invest wisely.

Shorted Bharti AirtelBharti Airtel looks Weak and has been selling off right from the start.
As you can see it has clearly rejected the Weekly Pivot which is a sign of weakness.
I have taken a short position for Target till 1526 level only.
This could either work out Intraday or STBT.

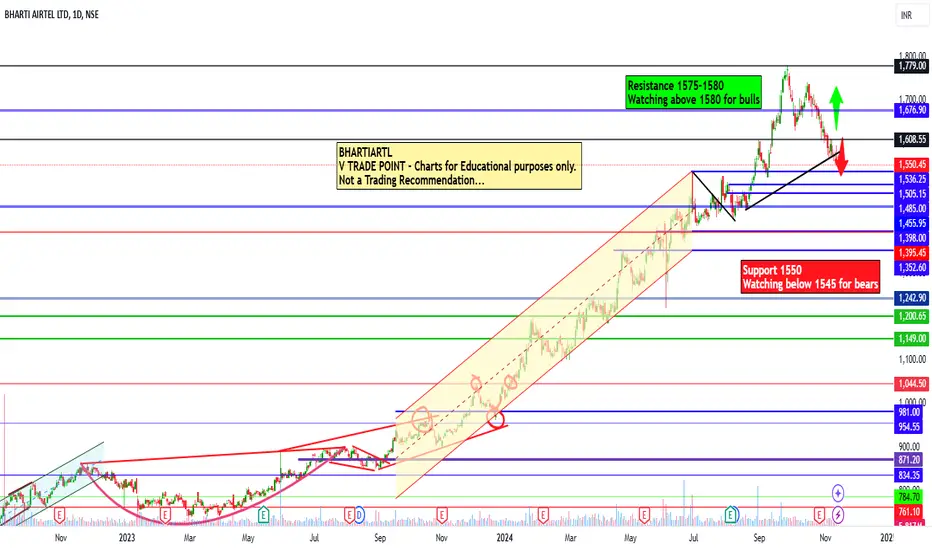
Bharati Airtel Ltd view for Intraday 14th Nov #BHARTIARTL Bharati Airtel Ltd view for Intraday 14th Nov #BHARTIARTL
Resistance 1575-1580. Watching above 1580 for upside movement...
Support area 1550. Below 1550 ignoring upside momentum for intraday
Support 1550 Watching below 1545 for downside movement...
Resistance area 1575-1580
Above 1570 ignoring downside move for intraday
Charts for Educational purposes only.
Please follow strict stop loss and risk reward if you follow the level.
Thanks,
V Trade Point
Bharati Airtel Ltd view for Intraday 13th Nov #BHARTIARTL Bharati Airtel Ltd view for Intraday 13th Nov #BHARTIARTL
Resistance 1575-1580. Watching above 1580 for upside movement...
Support area 1550. Below 1550 ignoring upside momentum for intraday
Support 1550. Watching below 1545 for downside movement...
Resistance area 1575
Above 1575 ignoring downside move for intraday
Charts for Educational purposes only.
Please follow strict stop loss and risk reward if you follow the level.
Thanks,
V Trade Point

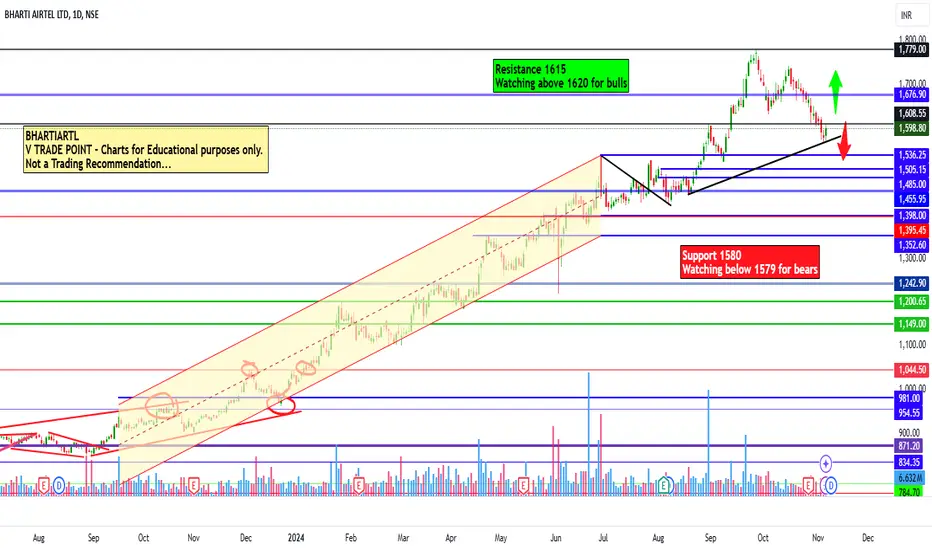
Bharati Airtel view for Intraday 7th Nov #BHARTIARTL Bharati Airtel view for Intraday 7th Nov #BHARTIARTL
Resistance 1615. Watching above 1620 for upside movement...
Support area 1580. Below 1600 ignoring upside momentum for intraday
Support 1580 .Watching below 1578 for downside movement...
Resistance area 1610-1615
Above 1605 ignoring downside move for intraday
Charts for Educational purposes only.
Please follow strict stop loss and risk reward if you follow the level.
Thanks,
V Trade Point
Bharti Airtel Intraday scalp opportunityBharti Airtel is showing a great reversal from it's Trend line and Monthly Support zone.
A quick long trade can be taken for a modest target of 1632.
An ATM CE Buy can be taken and you can hedge it with a far OTM CE Sell to create a Spread.

BUY at zone - swing / intradayENTRY
- lines marked below is potential reversal zone ( PRZ)
- entry is strictly inside the zone
- look for buying confirmation in smaller time frame ( 15 minutes preferred )
EXIT
1. target
- mark fib retracement from C to latest swing low
- TGT 1 - 0.236 fib level ( intraday tgt)
- TGT 2 - 0.382 fib level
- TGT 3 - 0.5 fib level ( preferred target )
2. SL
- candle close below (PRZ)
- if u didn't get confirmation inside the zone , ignore this pick
- if candle close is below zone , this pattern becomes invalid . IGNORE THIS PICK
- RE-ENTRY can be done , if u again get buying confirmation inside the zone

50 SMA Rising- Positional TradeDisclaimer: I am not a Sebi registered adviser.
This Idea is publish purely for educational purpose only before investing in any stocks please take advise from your financial adviser.
Its 50 SMA Rising Strategy. Suitable for Positional Trading Initial Stop loss lowest of last 2 candles and keep trailing with 50 days SMA if price close below 50 SMA then Exit or be in the trade some time trade can go for several months.
Be Discipline because discipline is the Key to Success in the STOCK Market.
Trade What you see not what you Think

BHARTI AIRTEL - Bullish SetupEnter only when 15minute candle closes above the Entry Zone Price - 1687.70
Targets are : 1745.25, 1802.8
Stoploss only when 15minute candle closes below the price - 1630.15
Note: This is not any financial advice, this is for education purpose only.

Bharti Airtel Ltd view for Intraday 19th September #BHARTIARTL Bharti Airtel Ltd view for Intraday 19th September #BHARTIARTL
Buying may witness above 1665
Support area 1630. Below ignoring buying momentum for intraday
Selling may witness below 1630
Resistance area 1665
Above ignoring selling momentum for intraday
Charts for Educational purposes only.
Please follow strict stop loss and risk reward if you follow the level.
Thanks,
V Trade Point

BHARTIARTL 1DBharti Airtel is exhibiting a strong uptrend, with resistance levels currently acting as support. This positive momentum is anticipated to persist for a sustained period.
I'm not a SEBI-registered analyst. All posts and levels shared are just for educational purposes. I'm not responsible for any losses or profits. No claims, all rights reserved

Airtel Demand zone in confluence with Fibbo 50.We can go long from 1520 with the tight SL of 1500.
Fantastic Risk/Reward ratio.
