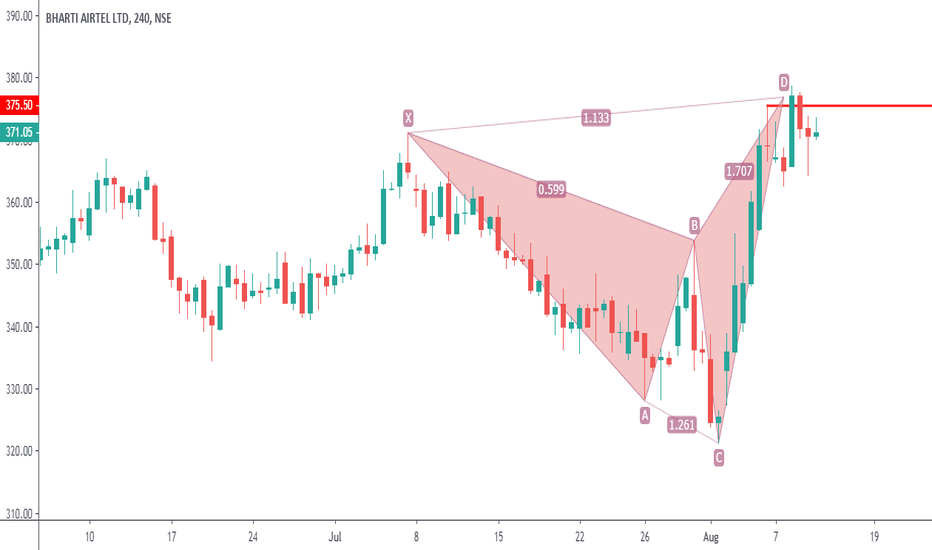
Airtel - DowntrendShort at upper resistance with a stop on the line. Long on a break upwards for an immediate target of 447 and 450.by V01Updated 1
Bharti Airtel Daily Chart Gartley PatternBharti Airtel Daily Chart Gartley Pattern CMP: 430 SL: 370 Target: 480, 560, Final 650Longby harshal_dj112
BHARTIAIRTEL at demand zone and resistance level .BHARTIAIRTEL at demand zone and resistance level . One can wait for the top of the green candle to get breached for entry . Targets mentioned in chartsLongby AkshayAhujaUpdated 1
Retracement in BhartiAirtelIt looks that on W - the stock has performed sincerely to respect the elliot waves. However, by the end of this week and with the beginning of the next a retracement is expected to be followed where the stock would dip to level sub-500 and attain or test the new support of around 477 and probabilistic-ally would continue the upward trend. Thus, we can maintain the calm and watch the stock for a possible pull back- where the people with sell side likeness can short sell in short term and those looking for a buy can wait to enter at a discounted level.Shortby Pivotal_Traders3
AIRTEL : Multi year iH&S pattern likelyAIRTEL : Multi year iH&S pattern likely above 450 for targets well beyond 650 .... WIll it this time ?Longby niftytrader3
20 day momentum//@version=3 strategy("Momentum Strategy", overlay=true) length = input(12) price = close momentum(seria, length) => mom = seria - seria mom mom0 = momentum(price, length) mom1 = momentum( mom0, 20) if (mom0 > 0 and mom1 > 0) strategy.entry("MomLE", strategy.long, stop=high+syminfo.mintick, comment="MomLE") else strategy.cancel("MomLE") if (mom0 < 0 and mom1 < 0) strategy.entry("MomSE", strategy.short, stop=low-syminfo.mintick, comment="MomSE") else strategy.cancel("MomSE") //plot(strategy.equity, title="equity", color=red, linewidth=2, style=areabr)by profit12344
Bharti Airtel - Rectangle bottom patternBharti Airtel testing the rectangle resistance line @ 380 where a lot of supply is currently visible in the rectangle bottom pattern formation A cup n handle formation within the horizontal rectangle Bottom pattern is visible. A Close above this resistance line would signify an upward breakout. High volumes expected. Trading strategy : Buy above 382 Target price : 420 Stop loss 363 Happy trading.Longby wildwildmoneyUpdated 4
Bharti airtel trading ideaBharti airtel has been doing sideways move for sometime. Currently it is at lower end of the channel (360). Traders can initiate a buy at lower end of channel and target at least upper end (380) of channel. Eventually i expect it to break the channel and move higher.Longby VikramGopalAimanda112
Corrective Up side for Airtel?We might have just completed a Flat on a lower degree, waiting to make a flat on a higher degree. I am looking for a move up to the 127.2% at 359 if the price moves above 343. stop loss would be 332. Watch out for the possibility of a smaller wave as we can always see a running flat where the C never travels the full distance. Also notice the bullish divergence on the MACD. Longby UnknownUnicorn556824Updated 4
BHARTIARTL (Bharti Airtel Ltd.) - Dialing The Downside - 12/27/2Bharti Airtel Ltd's stock ( Ticker BHARTIARTL ) has been in sideways consolidation for roughly about 8 years from 2008 to 2016, with a broad range of 240 - 440/480. We have traded this range successfully with simple sideways trading strategy where you buy at the range support and sell near range top. But this time we are less inclined to get involved, at least for long-term full fledge play. Reasons for change are, - New player - Reliance Jio - is going to disrupt the Indian telecom market and will decimate even existing thin margins. - Not necessary that Reliance Jio will be successful in making profit ( To understand why telecom companies can't be hugely profitable, please read our post on RCOM - Reliance Communication, where we have mentioned the reasons for not to invest in RCOM considering it as cheap play !) but unfair competition will hurt others until things get worse. - Reliance Jio has deep pockets as well as blessings of government and that government support part makes it very dangerous competition for others. You can outsmart the business and win but against government, hardly anyone can win ! Yes folks, politics is very import part of stocks trading, especially now, when governments across the world are interfering more and more e.g. Checkout the defense and finance sector stocks after Donald Trump win in USA, Stock performance of Adani companies in India after Modi became PM etc. - Besides, general investment climate is still shaky in India and broad market weakness will play it's part too. So we are not constructive on IDEA and Bharti Airtel stocks until things change. First stop to evaluate the situation and make a decision will be near 200 support level for Bharti Airtel Ltd. by BombayBulls5
Airtel soon taking off flight its a reversal Point A - 25.1.2016 first bottom Point B - 07.11.2016 Second bottom Immense support @ 282 levels and a very small resistance at 330 levels Longby ppiyush09Updated 220
Bullish on Bharti AirtelBharti Airtel could have completed a Flat pattern with wave c extension. I was expecting the up move to start at 333 in case of a regular flat (link attached). A move below the end of wave c would negate the setup and hence could be used as SL.Longby tushargupta1991112
Short AirtelDo I need to see anything more ? Broken all moving averages daily and weekly. Broken box range. Fundamentals are challenged. Tough times ahead for telecommunication industry. It should retest levels of 277 in days to come. Shortby ShobhitAgarwal2
BHARTI AIRTELNSE:BHARTIARTL Bhartiartl is moving down may touch level at 344.40 Happy tradingShortby saurabh112
Bearish then bullish on Bharti AirtelAirtel seems to be tracing out a flat pattern. A lower breakout should start the final wave 5 of wave C of flat down, following which it should go up.Shortby tushargupta19912
Bharti Airtel - Connects a "Double Bottom" signals a BUY Double bottom and a positive hammer candlestick formation confirm buying at current levels. It signals a buy opportunity at minimum risk. T1: 360 SL: 337 If it breaks support of 337 then it may go down to 328, keep a good watchLongby NeeteshJain5
h&s trading strategy bharti airtel look week below 345 1 target 333.55, 2nd target 321.40, and 3rd target is304 Shortby sameer473
buy bharti airtel with small risk bharti airtel buy levels 345-350 levels for the immediate target 380-390Longby BijeeshVp0