BHEL BuyBHEL seems to take support at channel support-line. Buy @CMP (260) with a SL of 240 and target of 265, 280 & 300
BHEL trade ideas

BHEL- LONGNSE:BHEL Weekly continuous formation with strict tight channel may continue further bullish rally in near term.

BHEL🚀 3. Trade Setups
▶️ ENTRY 1: Momentum Buy (Breakout)
Entry: ₹251
SL: ₹240
Risk: ₹11
Target: ₹627 (Long-Term Target)
Reward: ₹376
RR: ~34.2
Bias: Short-Term breakout above ₹327 → multi-year Fibonacci/GANN projections.
▶️ ENTRY 2: Value Buy (Swing to Positional)
Entry: ₹191
SL: ₹165
Risk: ₹26
Short-Term Reward (2–3 yrs): ₹436
🔍 BHEL Trade Plan – Strategic View (2025–2030)
✅ 1. Multi-Timeframe Demand Zone Summary
Timeframe Type Proximal Distal Avg Zone Type
Yearly Resistance → Support 199.7 191.85 196 🔥 Major LT Demand
6-Month BUFL 199.7 191.85 196 Strong LT Demand
Quarterly BUFL 199.7 191.85 196 Strong MT Demand
Monthly SWAP 176.5 165.8 171 Swing Buy Zone
Weekly DMIP SWAP 190.85 165 178 Swing + Positional
Weekly (Fresh) DMIP 251 240 246 Momentum Entry
🔷 2. GANN Levels Interpretation
Type Proximal Distal Avg Action
Long Zone 193 165 179 ✅ Stay Long > 193 confirmed
Short Zone 165 160 163 ❌ Short only if <165 breached
Long-Term Target (4–6 yrs): ₹627
RR (Short Term): ~16.7
RR (Long Term): ~24.1
Bias: Positioned inside Yearly + Quarterly Demand + GANN cluster zone → compounding zone.
📊 Swing Structure Reference
Parameter Value
Last High ₹327
Last Low ₹177
Target Zone ₹627 (based on historical FIB extension + volume profile projection)
🔑 Key Takeaways
✅ BHEL is structurally in a strong long-term uptrend.
🔄 Buy-on-dips strategy near ₹191 is ideal for investors & positional traders.
🚀 ₹251 breakout entry is for aggressive traders with close SL.
📈 RR ratios are excellent, aligning with long-term wealth-building.
🧠 Add position on confirmation above ₹327 to ride into ₹400+ zone with trail.

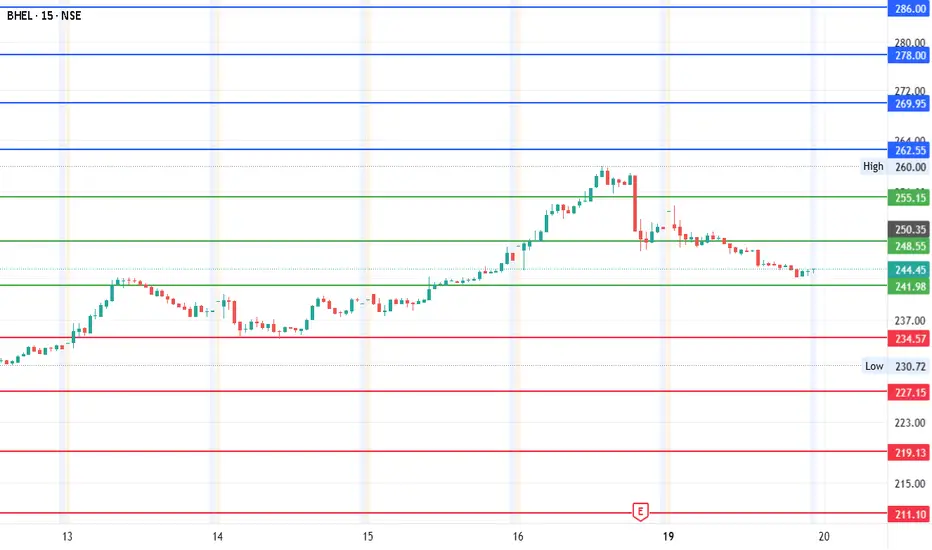
#BHEL - Target 211 or 286? Date: 19-05-2025
#BHEL
Current Price: 243.78
Mid-Point: 248.55
Upside Targets: 262.56, 269.95, 277.98 and 286.00
Downside Targets: 234.57, 227.15, 219.13 and 211.10
Support: 241.98
Resistance: 255.17
If you are planning to trade, the mid-point is the best place with the hedging.
BHEL | Buy @LTP | SL below 240 | 1st Target 290, 2nd 330Disclaimer:
This is not financial advice. Please do your own research or consult with a financial advisor before making any investment decisions. Investments in stocks can be risky and may result in loss of capital.


BHEL – The Wave Analysis That Spoke Before the Fall (335-200)
Back when BHEL was trading near 275 (March 2024), I raised my eyebrows and published an idea called Trader’s Trap. While I might have been a bit fast-forward (6 months ahead), my concern about the stock in March 2024 finally started unfolding in September 2024, after it topped at 335 highs.
From March 2024, the way BHEL was moving was not convincing—and you know what? This is the one stock that even made me review the Nifty Index. No surprise that Nifty itself started falling in September–October 2024, shaking up traders and investors alike.
Nifty’s Reality Check – Market Must Have Troubled Your Portfolio Too
If the past 5–6 months have made you wonder why your portfolio is struggling, let me remind you:
The rosy gains that started unfolding during-COVID-2020 have suddenly started to crack, making many traders think:
What exactly happened?
Why did everything look good until it didn’t?
Well, welcome to the real world! But here’s the catch—Waves tell the real story before it happens.
BHEL Slipping Below 200 – A Psychological Breakdown
As BHEL dips below the 200 psychological level, even mainstream financial analysts have started to rethink where this stock is heading next.
Some of the snapshots I’m sharing are part of WaveTalks upcoming project , showing that concerns were evident near 275—well before the storm hit in Sep 2024
Sep 2024 Snapshot from the project
Elliott Wave Analysis – BHEL’s Journey Through Waves 2020-2022
BHEL was a great pick in 2020 and later again in 2022, offering two golden opportunities for investors who understood Elliott Wave structures.
2020-2022: The stock unfolded a Falling Wedge, a classic reversal pattern indicating an upcoming trend shift.
2022: A Truncated Fifth Wave unfolded —an advanced Elliott Wave signal that often marks the end of a prolonged downtrend and the beginning of a powerful reversal.
Truncated Fifth Wave Explanation:
A truncated fifth wave occurs when Wave 5 fails to exceed the end of Wave 3 in an impulse structure. This can happen in both uptrends and downtrends.
In BHEL’s case, the truncation occurred in 2022 during a downtrend , signaling that the bears had exhausted their momentum and a new bullish cycle was on the horizon .
If you missed picking up BHEL in 2020, 2022 was your second chance —a rare Elliott Wave phenomenon that many fail to recognize in real time. And let's be honest, navigating through the chaos of COVID-19 was tough —it needed more than just technical analysis; it needed divine timing!
This is the power of Elliott Waves—predicting trends before they happen.
When new prices and updates come in, wave counts have to be adjusted accordingly—that’s how you extract maximum results.
Blaming Won’t Help – Adapt & Modify Your Analysis
Multiple wave counts exist at any given moment—and if rules get violated, you must quickly adapt, adjust, and move forward.
But if you get emotional and start saying:
❌ Elliott Wave doesn’t work!
❌ It’s too subjective!
I don’t agree. Why? Because applying Wave Analysis requires a solid foundation—not just blind conviction. Instead of blaming the subject or analysts, ask yourself:
✅ Why did I go wrong?
✅ What did I miss?
Stop blaming, start learning.
State Elections & Market Psychology – The Blame Game Never Ends
You see this same mentality in elections:
✔️ When you win, EVMs are fine, and the Election Commission is doing great.
❌ When you lose, suddenly, the system is rigged.
It's the same in trading—blaming the market, the strategy, or the analysis or analyst won't help. The real winners are those who educate themselves, adapt, and grow instead of making excuses.
Final Thoughts – Catch the Next Big Idea on WaveTalks
Markets evolve, waves adjust, and only those who stay flexible and unemotional can truly capitalize on opportunities.
Stay tuned for another exciting idea from WaveTalks—because Market Whispers! Can you hear them? 🔥

Chart of BHELBHEL chart on Daily candle is showing Ascending channel. Where it touches low and gives swing till high of Channel.

BHEL Swing TradeHello,
Trend-Based Analysis. Buy the Dips, Sell The Rallies, Also Following the Trend. Let's see where the Price Action takes us, Riding the wave. Potential trade setups based on trend momentum.
Technical analysis based on trend identification and momentum, Looking for high-probability setups within the prevailing trend.
Analyzing the current market trend and potential future price movement. Focusing on risk management and reward-to-risk ratios.
Details is Mentioned in Chart, Read carefully.. .

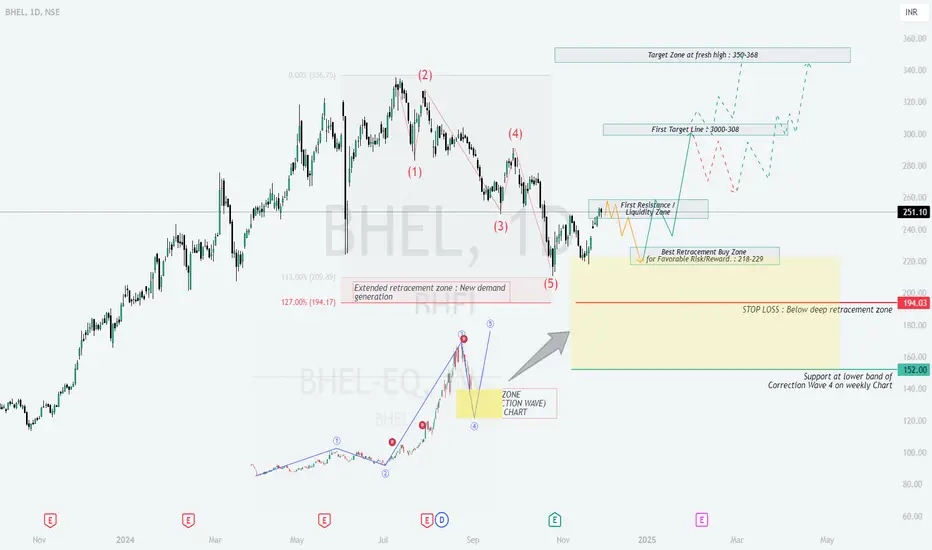
BHEL : What is next?BHEL Stock Analysis
Entry Zone : ₹218–₹229 (Ideal buying range).
Targets :
First Target : ₹300–₹308.
Final Target : ₹350–₹368.
Stop Loss : ₹194 (Below the extended retracement zone).
Analysis Highlights:
The stock is in a corrective phase but shows potential for a strong rebound from key support zones.
Short-term resistance at ₹255–₹260. Breakout above this could lead to a rally.
Action Plan : Accumulate in the buy zone for swing trading with controlled risk and solid upside potential.
Deeper and Educational Insights
Elliott Wave Theory Application :
The stock is completing corrective Wave 4-wave pattern . This is followed by a impulsive Wave 3 , typically retracing a portion of the prior rally.
The retracement aligns with Fibonacci levels , highlighting ₹218–₹229 as a high-probability buy zone .
Key Levels to Watch :
Support Zones :
₹218–₹229: This is the primary retracement buy zone for a favorable risk/reward ratio.
₹152: The final support at the lower band of the correction zone on the weekly chart.
Resistance and Target Zones :
₹255–₹260: First resistance and liquidity zone. Expect price to pause or consolidate here.
₹300–₹308: First target zone, where partial profit booking is advisable.
₹350–₹368: Final target zone, marking a fresh high.
Risk Management :
Stop Loss : Place below ₹194 to limit downside risk. This aligns with the deep retracement zone and protects capital in case of extended corrections.
Entry Strategy :
Use staggered buying within ₹218–₹229. This method helps reduce risk exposure in case of volatility.
Market Psychology :
The current corrective phase represents profit-taking and demand generation . Once buyers regain momentum, the stock is likely to test higher resistance zones.
Why This Setup Works :
The retracement zone reflects institutional demand , and historical price action suggests strong support levels in this area.
The alignment with Fibonacci levels and Elliott Wave theory increases the probability of a successful trade.
Key Takeaways for Learning:
Always identify buy zones based on technical indicators like Fibonacci and chart patterns.
Use stop-loss orders to limit downside risk and protect capital.
Monitor resistance levels for partial exits and re-entry opportunities.
Conclusion :
This setup is a textbook example of combining Elliott Wave Theory with Fibonacci retracement. Traders can use this to plan entries, exits, and manage risks effectively. It’s a bullish scenario with clear targets and defined risk limits.
SWING TRADE- BHEL
Stock breaking out trendline after good correction can be a good reversal trade, low risk high reward potential TARGET 260 270 280 SL 232 ON CLOSING BASIS
BHEL towards 400 after a healthy correction from 335BHEL has shown a good sign of reversal from MACD & RSI indicators.
It has also formed Alternate BAT pattern or Crab pattern to show bullish sign.
This will take it to 400 over period of 5 months time with following target levels,
Target1: 280 to 300
Target2: 350
Target3: 390 to 400

BHEL Bears Dominate – TP1 Hit, More Downside Expected!Technical Analysis: BHEL (Bharat Heavy Electricals Ltd) – 1D Timeframe (Short Trade)
We initiated a short trade on BHEL at 288.71 on 2nd September 2024, using the daily timeframe. The first target (TP1) at 259.89 has already been hit, and we are now looking ahead for further bearish momentum.
Key Levels
Entry: 288.71 – The trade was initiated following bearish signals and strong confirmation for a downward move.
Stop-Loss (SL): 312.03 – Positioned above the entry to manage risk and protect against reversals.
Take Profit 1 (TP1): 259.89 – Already hit, confirming the success of the initial short move.
Take Profit 2 (TP2): 213.25 – The next short target to be tested as bearish momentum builds.
Take Profit 3 (TP3): 166.62 – If selling pressure continues, this level could be achieved next.
Take Profit 4 (TP4): 137.79 – The ultimate target for this short trade setup.
Trend Analysis
BHEL is showing strong bearish signals, with price clearly below the Risological Dotted Trendline, confirming the downtrend. With TP1 already done, we expect the continuation of the bearish move towards TP2 and beyond.
BHEL has already reached its first profit target, demonstrating the strength of the bearish trend. The remaining targets are now in focus as we anticipate further downward movement in the coming days.

Bharat Heavy Electricals (BHEL) Long Trade Setup on RisologicalTrade Setup: A long trade setup has been identified with entry and target levels charted. As of now, none of the targets have been reached.
Entry Point: ₹229.73
Stop Loss (SL): ₹220.21
Target Levels (Take Profit):
TP1: ₹241.48
TP2: ₹260.51
TP3: ₹279.53
TP4: ₹291.29
Technical Indicators:
Risological Trend Line (Dotted Line): The dotted trend line acts as dynamic support, helping to confirm the bullish momentum. If price continues to respect this line, it may support a potential upward move toward the targets.
Volume Analysis: Current volume stands at 29.44M, higher than the 30-day average volume of 19.17M, indicating increased trading interest and potential momentum in favor of this setup.
Fundamental Context: With the next earnings report scheduled in 100 days, this setup is primarily based on technical indicators and market momentum. The solid market capitalization of ₹800.18B indicates BHEL’s stable position, possibly attracting institutional interest.
Outlook : Watching for price action near the Risological Trend Line. If volume sustains and price respects this support, there’s a high probability of achieving TP1 and moving towards higher targets. Traders should monitor price reaction near TP1 for any signs of resistance or breakout continuation.

BHEL S/RSupport and Resistance Levels:
Support Levels: These are price points (green line/shade) where a downward trend may be halted due to a concentration of buying interest. Imagine them as a safety net where buyers step in, preventing further decline.
Resistance Levels: Conversely, resistance levels (red line/shade) are where upward trends might stall due to increased selling interest. They act like a ceiling where sellers come in to push prices down.
Breakouts:
Bullish Breakout: When the price moves above resistance, it often indicates strong buying interest and the potential for a continued uptrend. Traders may view this as a signal to buy or hold.
Bearish Breakout: When the price falls below support, it can signal strong selling interest and the potential for a continued downtrend. Traders might see this as a cue to sell or avoid buying.
20 EMA (Exponential Moving Average):
Above 20 EMA(50 EMA): If the stock price is above the 20 EMA, it suggests a potential uptrend or bullish momentum.
Below 20 EMA: If the stock price is below the 20 EMA, it indicates a potential downtrend or bearish momentum.
Trendline: A trendline is a straight line drawn on a chart to represent the general direction of a data point set.
Uptrend Line: Drawn by connecting the lows in an upward trend. Indicates that the price is moving higher over time. Acts as a support level, where prices tend to bounce upward.
Downtrend Line: Drawn by connecting the highs in a downward trend. Indicates that the price is moving lower over time. It acts as a resistance level, where prices tend to drop.
RSI: RSI readings greater than the 70 level are overbought territory, and RSI readings lower than the 30 level are considered oversold territory.
Combining RSI with Support and Resistance:
Support Level: This is a price level where a stock tends to find buying interest, preventing it from falling further. If RSI is showing an oversold condition (below 30) and the price is near or at a strong support level, it could be a good buy signal.
Resistance Level: This is a price level where a stock tends to find selling interest, preventing it from rising further. If RSI is showing an overbought condition (above 70) and the price is near or at a strong resistance level, it could be a signal to sell or short the asset.
Disclaimer:
I am not a SEBI registered. The information provided here is for learning purposes only and should not be interpreted as financial advice. Consider the broader market context and consult with a qualified financial advisor before making investment decisions.

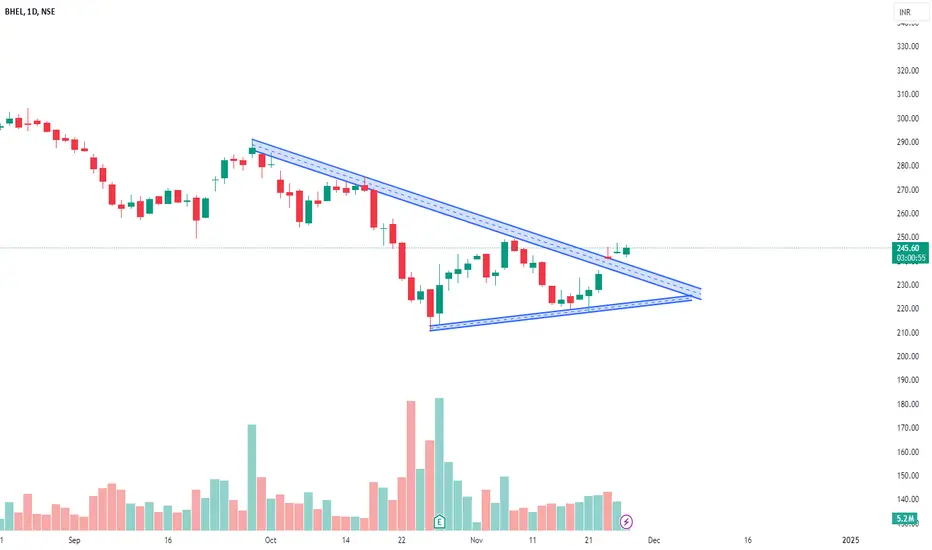
BHEL - Approaching Key Support Zone (Swing Trade Setup)BHEL is currently approaching a major support zone around the 220-230 range , which has held strong in the past (highlighted by the blue arrows). This zone has provided multiple bounces previously, and it will be crucial to see how the price reacts here.
Support Zone: 220-230 range
Current Price: 223.70
Entry Strategy: I’ll be watching for a bullish or green daily candle to form near the support zone. Once that happens, I’ll look for a 15-minute candle to break the high of the bullish daily candle to confirm my entry.
RSI Insight: The RSI is currently around 24.44 , suggesting the stock is in oversold territory, which could increase the likelihood of a bounce from the support zone.
If the support holds and we get a confirmed bullish daily candle , combined with the RSI in oversold territory, this could set up for a solid swing trade.
Disclaimer: This post is for educational purposes only and not financial advice. Always manage your risk and trade responsibly.

BHEL LongBHEL looks bullish after correction of A=C and now moving upward can try for long for targets
T1 295
T1 310+
Disclaimer: this is only for study purpose please make your own analysis before trading and trade safe

BHEL can target 316 off here?Eyes on the breakout! 🎯 BHEL targeting 316 with a tight invalidation below 282. Risk-managed and ready for the move! 📈💪

Bharat Heavy Electricals Limited (BHEL) Bullish Bharat Heavy Electricals Limited (BHEL)
I am seeing short-term bullish potential in BHEL.
This is for educational purposes only.

BHEL LONG 263-220 Target 320 Current Status :
BHEL Weekly DMIP @262
BHEL Daily DMIP @217
MTF Analysis:
BHEL Yearly Demand @48
BHEL 6 Month BUFL @200
BHEL Qtrly BUFL @200
BHEL Weekly BUFL @262

BUY at zone - swing / intradayENTRY
- lines marked below is potential reversal zone ( PRZ)
- entry is strictly inside the zone
- look for buying confirmation in smaller time frame ( 15 minutes preferred )
EXIT
1. target
- mark fib retracement from C to latest swing low
- TGT 1 - 0.236 fib level ( intraday tgt)
- TGT 2 - 0.382 fib level
- TGT 3 - 0.5 fib level ( preferred target )
2. SL
- candle close below (PRZ)
- if u didn't get confirmation inside the zone , ignore this pick
- if candle close is below zone , this pattern becomes invalid . IGNORE THIS PICK
- RE-ENTRY can be done , if u again get buying confirmation inside the zone

BHEL - (6-10%) up then 20% DownBHEL
Super favorite of Traders and Investors.
For PA Traders both opportunity exists.
Up move will face resistance at 6-10% up from current Levels.
Down move may see 20-25% from the top
Levels and the probable trajectory depicted on the chart.
