BHEL DAILY CHARTBHEL likely to take out its previous highs,
Time to keep an eye
Cmp 85.70 Breakout @ 88 Target 106
(its any observation & not a suggestion)
BHEL trade ideas

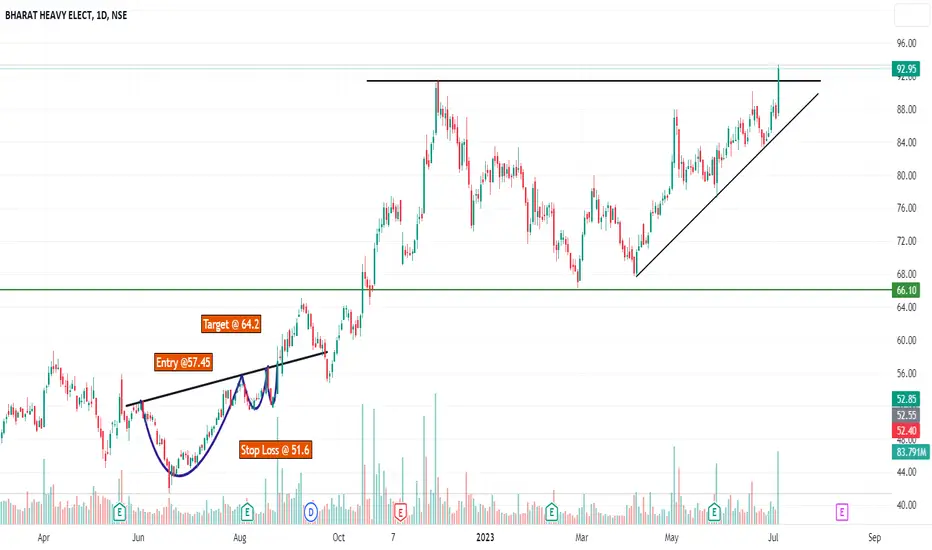
BHEL INVESTMENT TRADE WITH AMAZING RESULTS
Wave 1 and Wave 2 are complete Wave 3 is Onn
Price has formed a Demand in 6 Month chart
Define ur risk and let ur Rewards grow exponentially !!!
ENJOY THE RIDE ! ! !

Triangle Resistance BreakoutPlease look into the chart for a detailed understanding.
Consider these for short-term & swing trades with 2% profit.
For BTST trades consider booking
target for 1% - 2%
For long-term trades look out for resistance drawn above closing.
Please consider these ideas for educational purpose
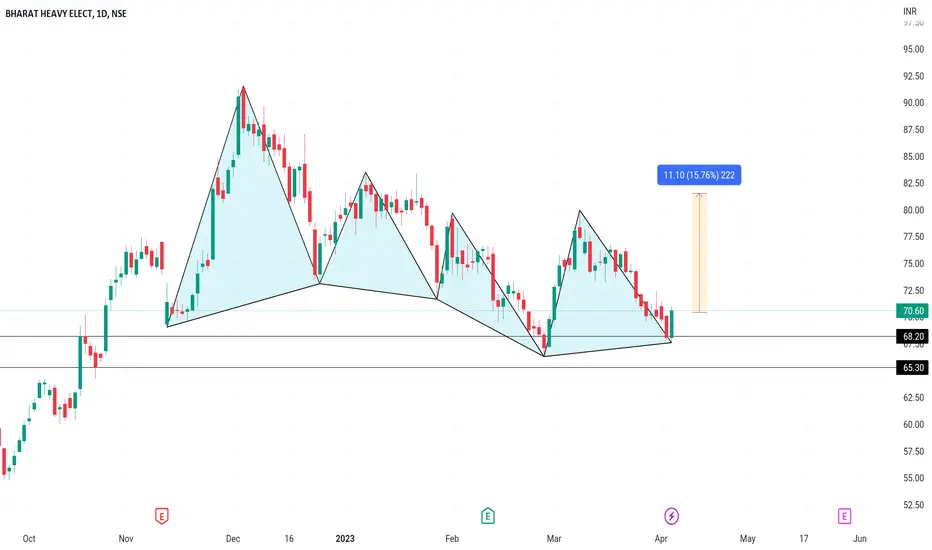
Inverse head and shoulder pattern..... BHELAt the verge of breakout........... it's pattern which having 90% sucess ratio historically

70 pc gain possibleBHEL above key moving averages in long term chart. Next stop as per Fibonacci retracement is 152 in a year.

BHEL - Looking good to retake some old highsThe stock is seeing almost five year High. On the weekly we can see a a nice VCP pattern.
On the Daily chart it is coming out of the supply shadow of effectively two "BC' Bars. Today we saw a High Volume "Effort to Move up" bar. The Relative Strength is also Positive.
After a long time the stock seems to be gathering the strength move up and scale up retake some of the old highs

Breakout with confirmation candle🤫🚀Good Morning, to all the traders I believe in you that one day you gonna make it to the top just keep doing this, so now the point is that the BHEL had given breakout with a confirmation candle in weekly chart. Now there will be two targets for BHEL which we can see from the chart the 1st target might be 108-110 because there is a resistance at that area and the 2nd target might be 125-130 if it breaks the 1st resistance. Now the main question what is stop loss area for this stock so don't worry😉 the stop loss will be around 70-71 the REASON is after breakout at 79 around that area is acting as support so we can't consider it as stop loss area what if stock comes at 79 and climb back again towards the target. So that's why I choose 70-71 as a stop loss.
Personal view/analysis.😃

BHELBhel can buy on buy on this level. it is retracing after gud move. it can give target if 91 in short term. long term may have a good target.

Investment PickBHEL has given an Inverted Head and Shoulder breakout this week. Since past 5 years stock was consolidating below 82 and struggling to break this barrier. Now once can assume the down trend is over and we can expect up move in coming months. Target mentioned here are short - medium term. We will review the chart once these targets are hit.
Once can buy this stock in instalments/ SIP or on each dip. Stop loss is kept very deep as I'm expecting a huge upside. Once can change the SL as per their risk.
CMP - 83.2 W (2/6/23)
T - 100, 115 W
SL - 69 W

BHEL pending order @ 84Entry price 84
Qty 200
SL 1.5%
Placed pending buy order at 84
Waiting for order to hit for entry
SL is -1.5% from entry price
Consolidating in daily range looking for breakout setup

BHEL 15M (10/5/2023)NSE:BHEL
Hello traders ,
All important levels are drawn in the chart.Work with risk reward ratio. not taking a trade is also a trade.
A trade cant change anything keep in your mind,if you think one trade can change your life then you are doing gambling in the market.take calculated risk.

BHEL LONG-TERM TARGET INTACTBHEL LONG-TERM TARGET IS INTACT. HOLD AND WAIT.
Since the very beginning My target was 7X. Till now We Made 3x In Bhel.
If You Want To Be A Good Analyst Use Daily Weekly & Monthly Time Frame. for long-term traders (swing trade/positional)

BHEL WEEKLY BREAKOUT & AT RETEST LEVEL The price breaks the trendline which is acting as strong resistance for the price and also restested the trendline breakout level and now start moves for the upside levels. Price also formed flag and pole pattern in daily timeframe and also given breakout.
#BHEL
👉Trendline Breakout & Retest in Weekly TF
👉Stock in Uptrend & Bullish Pattern
👉Flag & Pole BO on Daily TF
👉Looking good for short Term Swing
👉PSE Stocks in focus
👉Add To Your Watchlist✅

BHEL*BHEL*
C&H Pattern on Yearly Basis.
Price BreakOut.
Vol. Consolidation & Continued BuiltUp
Trail SL with Upside.
Book Profit as per Appetite.
Do Your Own Research as well.
This is just an Opinion.
Happy Investing:)

BHEL : Break the Trendline...!5 Step Analysis of BHEL
1.Stock on Daily TF we can see that from Dec.2022 stock was in downtrend and took support at 66 Level.
2. From Dec. Stock has made Flag Pattern and made double Bottom at 66 level.
3. Today Stock has given Breakout on Daily TF with high volume.
4. Stock Showing strength with strong Momentum and high volatility.
5. With the support of 66 level Enter at CMP upside move can see at 87 to 93 level in coming days.

BHEL (Swing):BHEL (Swing):
A 20-30% up move is on the cards.
Note: Do your own due diligence before taking any action.

May see a good upside side rally in BHEL.The presence of big institutions can be seen on the charts of BHEL. The big players have haunted the retailer's stop-loss from both ends. Now, a rally of 15% to 20% can be seen on the upside.
The investments discussed or recommended in the market analysis, research reports, etc. may not be suitable for all investors. Investors must make their own investment decisions based on their specific investment objectives and financial position and only after consulting such independent advisors as may be necessary.

#buy_BHEL TGT 80++ BHEL buy at level today tgt upto 80++ in this week looks one heather at77 then will touch 80 100%
#buy #sell #bhel #nifty #banknifty #profit #pms #trading #forextraders #stock #stocktraders

Some more upside expected for BHELOverall there is a turn that I'm noticing and price is looks like it is bouncing from a resistance area.

Bhel is all set for 78/80Bhel is ready for big up move
I'm bullish on pse sector and bhel is the best buy as of now
and also looking towards digit target in future

BHEL near trendline resistanceIf BHEL breaks the trendline resistance and retest... look for a buy setup.

BHEL Short - Distribution in progress
Valuation (P/E) has priced in the recent growth -> future Stock upward movement depends on Positive Earnings surprise
Possible Medium term targets mentioned on chart
Will revisit stock after a quarter
Expecting either a Sideways or Downward movement till then
