Biocon: Heading for All-Time High?🚀 Biocon: Heading for All-Time High? 🚀
📉 CMP: ₹390
🔒 Stop Loss: ₹330
🎯 Targets: ₹428 | ₹478 | ₹560
🔍 Why Biocon Looks Promising?
✅ Weekly Rounding Bottom Breakout: Breakout triggered above ₹390
✅ Weekly Box Breakout: Confirmation above ₹398 strengthens the setup
✅ Final Confirmation: A weekly clo
Next report date
—
Report period
—
EPS estimate
—
Revenue estimate
—
8.45 INR
10.13 B INR
152.11 B INR
525.25 M
About BIOCON LIMITED.
Sector
Industry
CEO
Siddharth Mittal
Website
Headquarters
Bangalore
Founded
1978
ISIN
INE376G01013
FIGI
BBG000BJHBC9
Biocon Ltd. is a holding company, which engages in the manufacture, research, and development of therapeutic drugs. It operates through the following segments: Small Molecules, Biologics, Branded Formulations, and Research Services. The Small Molecules segment manufactures spanning statins, immunosuppressants, antifungals, anti-obesity, anti-diabetics, ophthalmologicals, oncologicals, and urologicals etc. The Biologics segment provides Insulins and Analogs, biosimilar Monoclonal Antibodies (MAbs), and recombinant proteins The Branded Formulation segment consists of therapeutic areas of diabetology, oncology, immunology and critical care. The Research Services segment covers Syngene development platforms. The company was founded by Kiran Mazumdar-Shaw on November 29, 1978 and is headquartered in Bangalore, India.
Related stocks

multiyear breakout candidate BIOCONNext laurus like move loading in biocon
rsi strong strong price action
volume pretty cool

BioconBiocon is trading above 200 ema on multi time frame
As marked it has consolidated for last few days suggesting accumulation phase. Any confirmation of price action on upper side will give good risk to reward trade.
This is only a chart analysis not a recommendation to buy or sell. Please consult yo
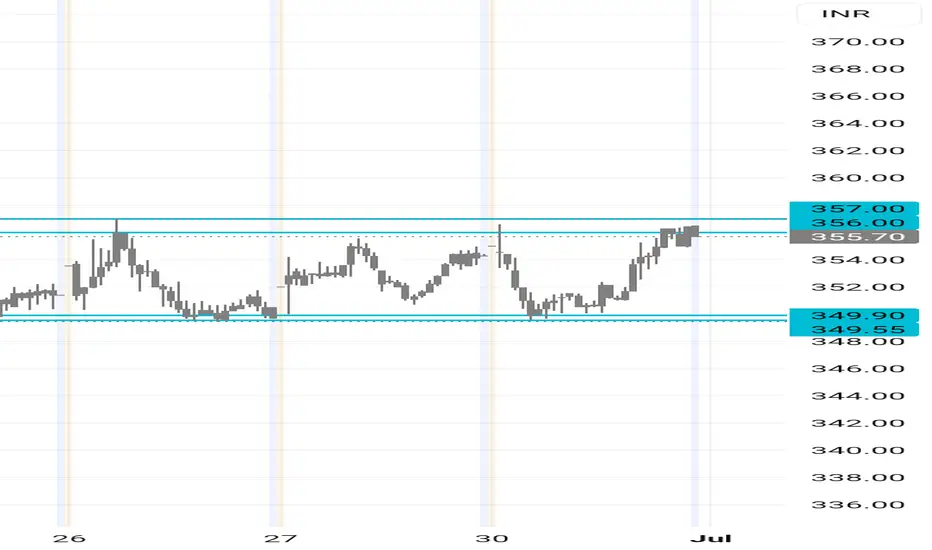
BIOCON LIMITED KEY ZONE !!This is the Daily chart of BIOCON LIMITED.
Biocon is currently trading near its pattern resistance zone around the 340 range.
BIOCON has a strong support zone near the 300 range.
Thank You !!

Biocon looks weakBiocon is not a buy from any angle at the moment. If you want to invest in it, buy it in bits and pieces. For swing traders, the risk reward is to the downside. Forming Head and Shoulders on weekly. Head and shoulders is a very powerful pattern, and the expected move to the downside would be almost

BIOCON LTD SWING TRADE📊 Price Action & Trend Analysis
Analyzing market trends using price action, key support/resistance levels, and candlestick patterns to identify high-probability trade setups.
Always follow the trend and manage risk wisely!
Price Action Analysis Interprets Market Movements Using Patterns And Trend

BIOCONNSE:BIOCON
One Can Enter Now !
Or Wait for Retest of the Trendline (BO) !
Or wait For better R:R ratio !
Note :
1.One Can Go long with a Strict SL below the Trendline or Swing Low.
2. R:R ratio should be 1 :2 minimum
3. Plan as per your RISK appetite and Money Management.
Disclaimer : You a
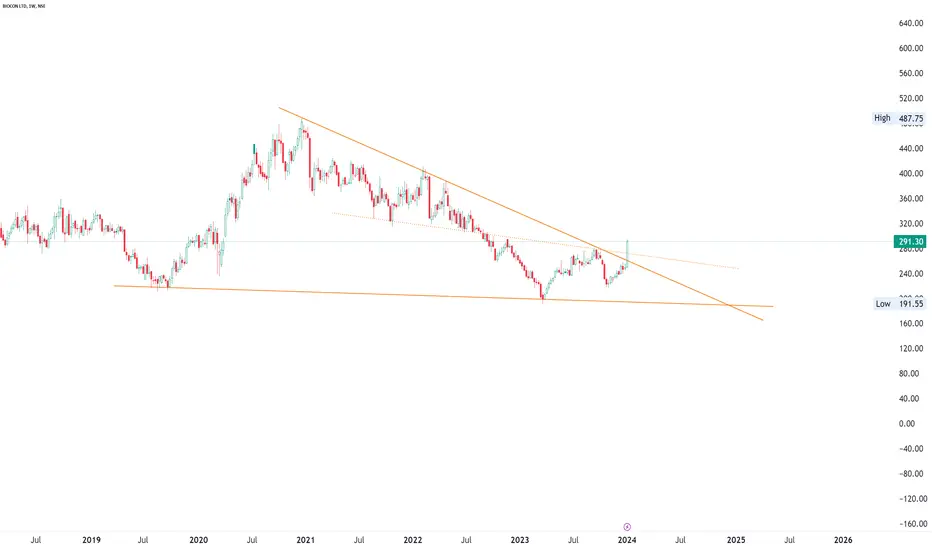
BIOCON |If weekly close above 400Disclaimer:
This is not financial advice. Please do your own research or consult with a financial advisor before making any investment decisions. Investments in stocks can be risky and may result in loss of capital.

Biocon Stock Analysis Current Landscape:
Market Cap: ₹46,547 Crores (Indicating a large-sized company)
PE Ratio: 32.34 (Slightly lower than the industry PE of 40.38, suggesting potential undervaluation)
Book Value: ₹174.85 (Represents the value of each share as per company accounts)
Price to Book Value (PBV): 2.22 (Indicates that the mark

BIOCON LTD S/RSupport and Resistance Levels:
Support Levels: These are price points (green line/shade) where a downward trend may be halted due to a concentration of buying interest. Imagine them as a safety net where buyers step in, preventing further decline.
Resistance Levels: Conversely, resistance levels (re

See all ideas
Summarizing what the indicators are suggesting.
Neutral
SellBuy
Strong sellStrong buy
Strong sellSellNeutralBuyStrong buy
Neutral
SellBuy
Strong sellStrong buy
Strong sellSellNeutralBuyStrong buy
Neutral
SellBuy
Strong sellStrong buy
Strong sellSellNeutralBuyStrong buy
An aggregate view of professional's ratings.
Neutral
SellBuy
Strong sellStrong buy
Strong sellSellNeutralBuyStrong buy
Neutral
SellBuy
Strong sellStrong buy
Strong sellSellNeutralBuyStrong buy
Neutral
SellBuy
Strong sellStrong buy
Strong sellSellNeutralBuyStrong buy
Displays a symbol's price movements over previous years to identify recurring trends.
Frequently Asked Questions
The current price of BIOCON is 382.95 INR — it has decreased by −2.08% in the past 24 hours. Watch BIOCON LTD. stock price performance more closely on the chart.
Depending on the exchange, the stock ticker may vary. For instance, on BSE exchange BIOCON LTD. stocks are traded under the ticker BIOCON.
BIOCON stock has fallen by −2.94% compared to the previous week, the month change is a 4.99% rise, over the last year BIOCON LTD. has showed a 5.99% increase.
We've gathered analysts' opinions on BIOCON LTD. future price: according to them, BIOCON price has a max estimate of 447.00 INR and a min estimate of 270.00 INR. Watch BIOCON chart and read a more detailed BIOCON LTD. stock forecast: see what analysts think of BIOCON LTD. and suggest that you do with its stocks.
BIOCON reached its all-time high on Dec 23, 2020 with the price of 487.70 INR, and its all-time low was 14.40 INR and was reached on Nov 28, 2008. View more price dynamics on BIOCON chart.
See other stocks reaching their highest and lowest prices.
See other stocks reaching their highest and lowest prices.
BIOCON stock is 2.58% volatile and has beta coefficient of 0.97. Track BIOCON LTD. stock price on the chart and check out the list of the most volatile stocks — is BIOCON LTD. there?
Today BIOCON LTD. has the market capitalization of 521.89 B, it has increased by 5.95% over the last week.
Yes, you can track BIOCON LTD. financials in yearly and quarterly reports right on TradingView.
BIOCON LTD. is going to release the next earnings report on Aug 7, 2025. Keep track of upcoming events with our Earnings Calendar.
BIOCON earnings for the last quarter are 2.81 INR per share, whereas the estimation was 1.39 INR resulting in a 102.25% surprise. The estimated earnings for the next quarter are 0.71 INR per share. See more details about BIOCON LTD. earnings.
BIOCON LTD. revenue for the last quarter amounts to 44.17 B INR, despite the estimated figure of 40.99 B INR. In the next quarter, revenue is expected to reach 39.78 B INR.
BIOCON net income for the last quarter is 3.44 B INR, while the quarter before that showed 251.00 M INR of net income which accounts for 1.27 K% change. Track more BIOCON LTD. financial stats to get the full picture.
Yes, BIOCON dividends are paid annually. The last dividend per share was 0.50 INR. As of today, Dividend Yield (TTM)% is 0.13%. Tracking BIOCON LTD. dividends might help you take more informed decisions.
BIOCON LTD. dividend yield was 0.15% in 2024, and payout ratio reached 5.91%. The year before the numbers were 0.19% and 5.85% correspondingly. See high-dividend stocks and find more opportunities for your portfolio.
EBITDA measures a company's operating performance, its growth signifies an improvement in the efficiency of a company. BIOCON LTD. EBITDA is 31.36 B INR, and current EBITDA margin is 21.93%. See more stats in BIOCON LTD. financial statements.
Like other stocks, BIOCON shares are traded on stock exchanges, e.g. Nasdaq, Nyse, Euronext, and the easiest way to buy them is through an online stock broker. To do this, you need to open an account and follow a broker's procedures, then start trading. You can trade BIOCON LTD. stock right from TradingView charts — choose your broker and connect to your account.
Investing in stocks requires a comprehensive research: you should carefully study all the available data, e.g. company's financials, related news, and its technical analysis. So BIOCON LTD. technincal analysis shows the neutral today, and its 1 week rating is buy. Since market conditions are prone to changes, it's worth looking a bit further into the future — according to the 1 month rating BIOCON LTD. stock shows the buy signal. See more of BIOCON LTD. technicals for a more comprehensive analysis.
If you're still not sure, try looking for inspiration in our curated watchlists.
If you're still not sure, try looking for inspiration in our curated watchlists.