BPCL trade ideas


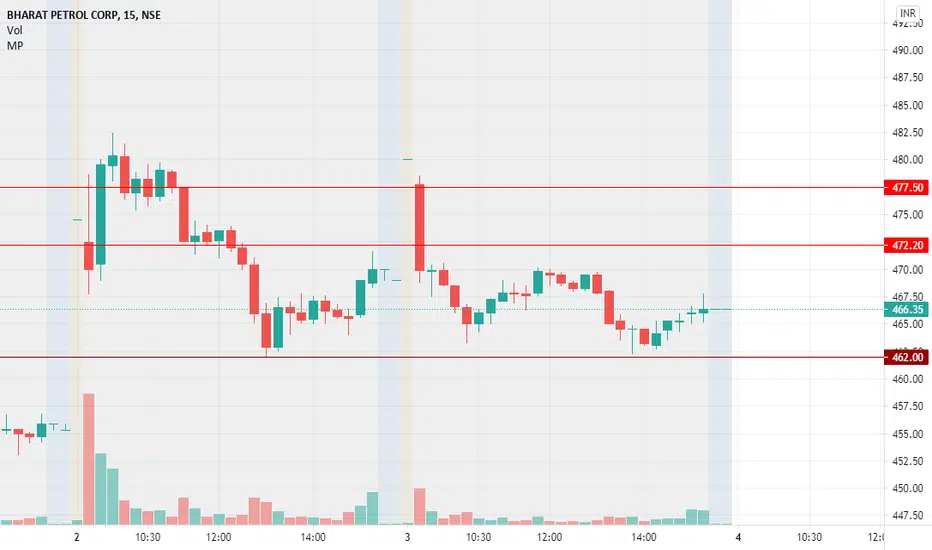
BPCL : Sustain Above Channel or channel rejectionChart and data says it may take rejection at channel end. Take position only if sustains above channel or be prepared to take short position.
Disclaimer :- Kindly do you own research before taking any position. Market is all about probability, maintain you SL stickily.


BPCL - Enter after the breakout Good for Positional Traders. Enter after the breakout or buy and hold.


Symatic pattern and if price close above 481 the longSymatic pattern and if price close above 481 the long

BPCL ready for breakout , GO longBPCL tested four top. Although Elliott ABCDE pattern is telling that it is Short, but I believe that it is looking for breakout for upper side. Let's see how it turns out.

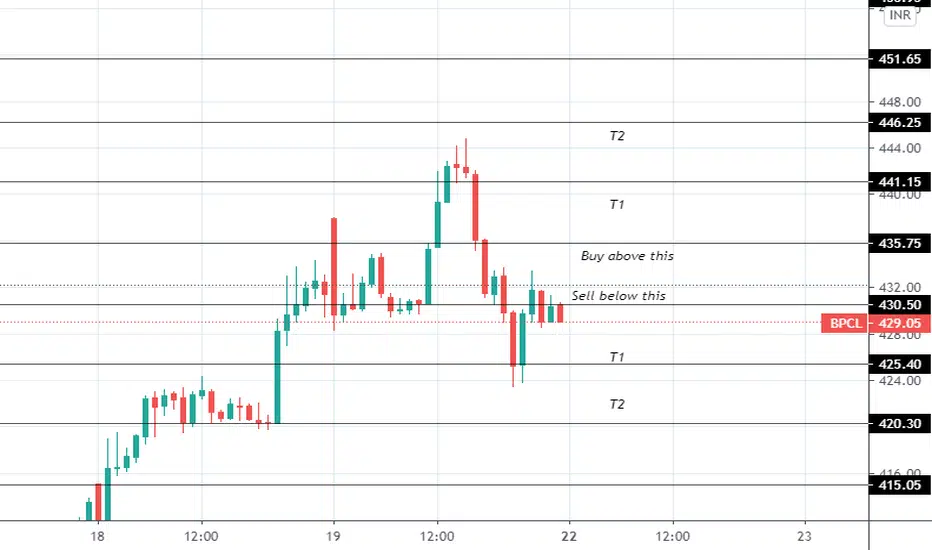
BPCL INTRADAY FEB 25 2021 LONG FOR INTRADAYDear trader,
If u look at the chart of BPCL (analysis based intraday only) the HDFC support 1 at 439 and support 2 at 435 and resistance at 455.
Forming a triangle on weekly timeframe and its near the breakout level can give good move if breakout happens on good volume in coming days.
In Intraday most important thing is to enter and exit points.
Our signals are based on analytics, algorithms, mathematical derivatives.
Always be a responsible trader, kindly trade only when you have maximum opportunity in the market with minimum risk and with keynotes like data, analysis and proper strategies.
Kindly message us for strategies and analysis.

BPCL came out of downtrend after Yr, 500,550 soonBPCL Has come out of a long term downtrend and sustaining well
480,500,550 levels looks possible on charts
Duration: 3 - 12 Months
Educational purpose

BPCL INTRADAY FEB 24 2021 LONG FOR INTRADAYDear trader,
If u look at the chart of BPCL (analysis based intraday only) the NIFTY support at 430 and and resistance at 445
The chart clearly indicates BPCL has come out of a triangle giving breakout on weekly chart ,you can also see the candle stick patters for more in depth analysis.
In Intraday most important thing is to enter and exit points.
Our signals are based on analytics, algorithms, mathematical derivatives.
Always be a responsible trader, kindly trade only when you have maximum opportunity in the market with minimum risk and with keynotes like data, analysis and proper strategies.
Kindly message us for strategies and analysis.


BPCL is looking very strongTriangle breakout
Harmonics in place
RSI gaining strength
Give that RSI level breakout and we are looking for 480 and 525 Sl is 395


