52 Week High Breakout - Positional Trade - Long TermDisclaimer: I am not a Sebi registered adviser.
This Idea is publish purely for educational purpose only before investing in any stocks please take advise from your financial adviser.
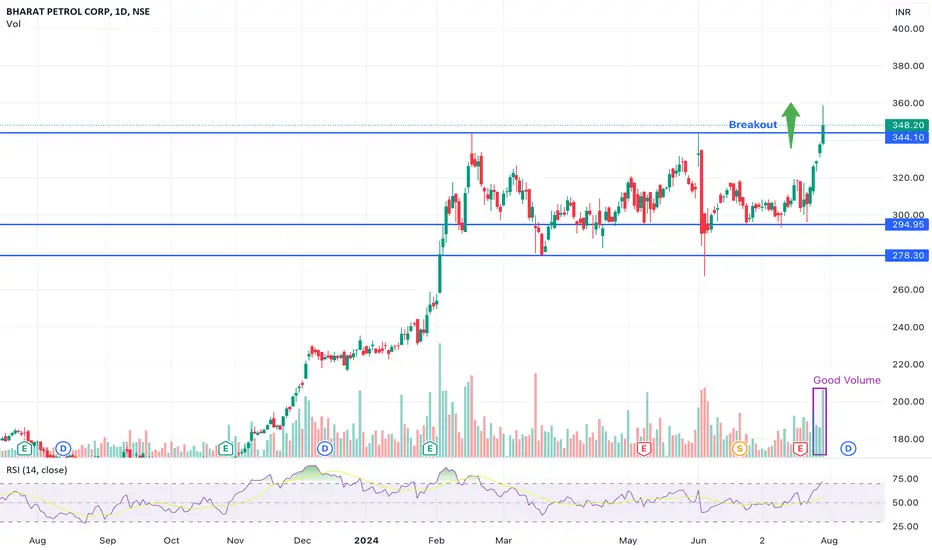
52 Week Breakout. Stock has Crossed 52 week High. Keep in watch list. Buy above the high. Suitable for Positional Trade. Stop loss & Target Shown on Chart. Stop loss Trail by 30 SMA. Exit if Price Close below 30 SMA on Weekly Chart.
Be Discipline because discipline is the Key to Success in the STOCK Market.
Trade What you see not what you Think.
BPCL trade ideas

BPCL Breakout Alert - Time to Ride the Bullish Momentum
Stock: Bharat Petroleum Corp Ltd. (BPCL) on Weekly Timeframe.
Current Price (CMP): ₹367.30
Breakout Zone: Clear breakout above the resistance level at ₹367.45.
Technical Pattern: Bullish ascending triangle indicating strength.
Action Point: Breakout confirmed, a potential buying opportunity.
Next Target: ₹380 and beyond, bullish continuation expected.
Support: Trendline support at around ₹330, offering a strong base.
Volume: Increasing volume confirming bullish breakout momentum.

BPCL - Multiyear breakoutTrade setup:
nearly 7 year breakout (270 INR), and consolidated (around 330 INR levels), and another breakout and retest.
the slope of 50 EMA on weekly time frame supports the setup.
RSI > 50 indicates strength.
Buy price = around 330 - 340 INR. one can also enter the trade once the relative strength comes back to >0.
SL = 260 INR
target 1 = range of consolidation zone = 403 INR
target 2 = mid / long term = depth of round bottom = 500 INR

BPCL LONGBPCL
MTF Analysis
BPCL Yearly Demand Breakout 242
BPCL 6 Month Demand BUFL 242
BPCL Qtrly Demand Breakout 301
BPCL Monthly Demand BUFL 301
BPCL Weekly BUFL 285
BOM Daily DMIP 327
ENTRY 327
SL 320
RISK 7
Target 407
REWARD POINT 80
Last High 367
RR 11.43
RR 24%

BPCLStock which broke its resistance failed 1st time. momentum picking up. Low of today candle sl and 10 % profit or 2 red candle below ema 9 exit .
Its my own analysis any suggestion comment below

Double Bottom Formation in BPCLBPCL currently is one of the best available value stocks in Indian Markets. The company has very healthy dividend yield as well. So, buying in cash market ensures the receipt of dividend as well.
Stock P/E - 3.98
Dividend Yield - 4.28 %
Sales Var 5Yrs % - 14.94%
ROCE 5Yr % - 15.59
Qualifies for a great stock to study at these levels in all the parameters.
Note: The studies shared are for educational purpose only. Do your own research before taking any monetary position.

BPCL S/R Support and Resistance Levels:
Support Levels: These are price points (green line/share) where a downward trend may be halted due to a concentration of buying interest. Imagine them as a safety net where buyers step in, preventing further decline.
Resistance Levels: Conversely, resistance levels (red line/shade) are where upward trends might stall due to increased selling interest. They act like a ceiling where sellers come in to push prices down.
Breakouts:
Bullish Breakout: When the price moves above resistance, it often indicates strong buying interest and the potential for a continued uptrend. Traders may view this as a signal to buy or hold.
Bearish Breakout: When the price falls below support, it can signal strong selling interest and the potential for a continued downtrend. Traders might see this as a cue to sell or avoid buying.
20 EMA (Exponential Moving Average):
Above 20 EMA: If the stock price is above the 20 EMA, it suggests a potential uptrend or bullish momentum.
Below 20 EMA: If the stock price is below the 20 EMA, it indicates a potential downtrend or bearish momentum.
Disclaimer:
I am not a SEBI registered. The information provided here is for learning purposes only and should not be interpreted as financial advice. Consider the broader market context and consult with a qualified financial advisor before making investment decisions.

BPCL 1WEEKALL TIME HIGH BREAK WITH A GOOD POTENTIAL.
.
.
.
.
.
.
.
.
I Am Not SEBI Registered Analyst. All Post and Levels Posting is only for educational and knowledge purpose. I Am not responsible for your any kind of loss or profit.
No Claim, All Rights Reserved.‼️

BPCL in BreakoutBPCL NSE:BPCL has formed a breakout. You can buy if a candle is getting closed above 344 and 395 would be the Target.

BPCL Breaks Out: Strong VolumeGood volume
Was in a range from February
Breakout resistance
Break resistance from February range
BPCL, Ascending TrianglePotential breakout from the Pennant,
Target at 376, Stoploss at 298
Disclaimer : I am a aspiring swing trader, i have only started to learn to catch the pattern. So, please take this only as a idea

BPCL-LONGBullish trend in formation on BPCL. Price action suggests further upside potential. Key support and resistance levels to watch. Consider long position with appropriate risk management.

BPCL-LONGSharing my bullish outlook based on BPCL. Would love to hear your thoughts and insights on this setup.

@BPCL Swing/short Trade@BPCL
Buy Above @629
SL Below @533
Target @686 , @782.
If you want minimize risks After Entry put @SL at last Higher-Low(HL) or follow trend line as SL or Trailing-SL
Plz Note : This levels are only for Swing Trade & Disclaimer: All Information on this page is for educational purposes only , we are not SEBI Registered . Please consult a SEBI Registered financial advisor for your Financial matter before investing & taking any decision. We are not responsible for any profit/loss you made.
Like, Comment & Share

BPCL: Gearing up fly high - Know Why!Daily Time Frame:
Key Points:
Breakout Confirmation: The stock has decisively moved past its 4 years long resistance, confirming the breakout.
Volume Surge: Accompanied by high trading volume, indicating strong market interest.
Target Potential: Eyeing a 50% upward move based on technical analysis.
Why This Matters:
Momentum: Breakouts like this often lead to sustained trends.
Opportunity: Ideal for traders looking for growth stocks with strong technical setups.
- Above 620 it will start to shoot and also EMAs have confirmed the bullish trend continuation.
- If you have liked my chart reading and analysis, don't forget to leave a comment and boost the post.
- Wish you all a profitable trading journey. Cheers!
Disclaimer: This is NOT a buy/sell recomendation. This post is meant for learning purposes only. Please, do you due diligence before investing.
Thanks & Regards

BPCL is ready for a bullish break outBPCL has been trading with good volumes on the bourses in recent months.
The 52W H/L being INR 484.60 / 314.10
It is consistently trading above its long-term Moving Average for the past 3 months
There is a positive divergence on the oscillators
It is standing right at the resistance level on higher time frames
Resultantly, I believe that the target price should be INR 545-555
Stop Loss should be INR 457.00
Risk to Reward will be 1:3
The time horizon should be 9-12 months

39% Lying on the Table in BPCL chartsThe fundamental situation, BPCL is in, I can not see it not going ahead and achieving the 39% technical targets.
Disclaimer: I am holding since 355 and have targets of almost 100% from current levels, i.e. of around 1150.
Trade/ make financial commitments at your own risk. This is to spread awareness and not intended as a buy/sell call. Always, do your own research and/or seek expert financial help.

BPCL- Strong breakout!!-Intraday Analysis for 27th May 2024
Check out swing analysis for overall view pinned below.
Now price reacted at 0.5 Fibonacci level & strong keylevel in upward range trend. If buyers not allowed to create one more higher low then strong movement expected with big breakout.
Price is following the upward channel
Buy Above:657
T1:666
T2: 674
Swing traders can hold for more time
Direct Gapup entry should be avoided
Get confirmation from any of the leading indicators before entering trade
Kindy comment below in case of any clarification required on this particular idea.
Please follow for more ideas

Intraday view for BPCL for today #BPCL Intraday view for BPCL for today #BPCL
Buying opportunity may witness above 662
Support area around 655-650
Charts for Educational purposes only.
Not a Trading Recommendation.
Please strictly follow Risk Reward and Stop Loss if you follow the levels.
Thanks,
V Trade Point

I alredy published before BPCL Brakeout Now target achivedI alredy published before BPCL Brakeout.Now target achived

BPCL S/RSupport and Resistance Levels: In technical analysis, support and resistance levels are significant price levels where buying or selling interest tends to be strong. They are identified based on previous price levels where the price has shown a tendency to reverse or find support.
Support levels are represented by the green line and green shade, indicating areas where buying interest may emerge to prevent further price decline.
Resistance levels are represented by the red line and red shade, indicating areas where selling pressure may arise to prevent further price increases. Traders often consider these levels as potential buying or selling opportunities.
Breakouts: Breakouts occur when the price convincingly moves above a resistance level (red shade) or below a support level (green shade). A bullish breakout above resistance suggests the potential for further price increases, while a bearish breakout below support suggests the potential for further price declines. Traders pay attention to these breakout signals as they may indicate the start of a new trend or significant price movement.
Disclosure: I am not SEBI registered. The information provided here is for learning purposes only and should not be interpreted as financial advice. It is important to consult with a qualified financial advisor before making any investment decisions. Tweets neither advice nor endorsement.

BPCL-Time to shift the gears for bulls? Week & Daily AnalysisNSE:BPCL
Overview:
After the big up trend from November 2023, price has broke previous ATH. Due to strong movement price has reached 20% above previous ATH. But Healthy breakout needs proper consolidation & also due to profit bookings price was under small retracement.
Again the price has bounced from previous ATH but this time with W Chart pattern(Day TF) & more importantly Fibonacci at 0.382 Level. Inside candle price break in weekly time frame & also in Day TF indicates strong movement ahead
Buy: Above 654
1st Target(Swing traders): 688
2nd Target(Investment): 750
Get confirmation from any of the leading indicators before entering trade
Kindy comment below in case of any clarification required on this particular idea.
Please follow for more ideas
“The goal of a successful trader is to make the best trades. Money is secondary.” - Alexander Elder

BPCLBPCL
BPCL Looking good if sustains above 654
Weekly inside bar breakout awaited above 689 for more confirmation
#BPCL
