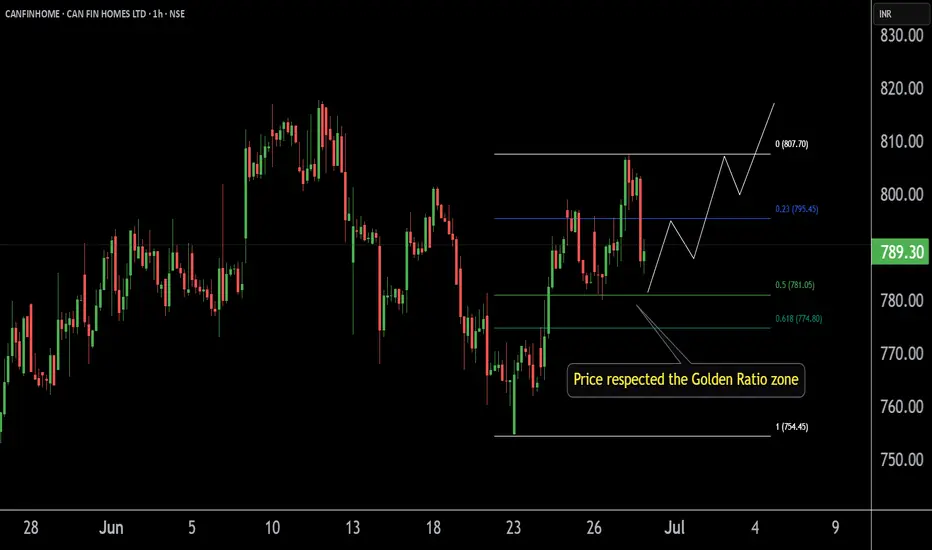
CANFINHOME'S Key ZoneThis is the 1 hour chart of CANFINHOME.
Canfinhome is taking support at the Fibonacci Golden Ratio zone.
If this zone is sustain then we may higher price in CANFINHOME .
Thank You !!
CANFINHOME trade ideas
CANFINHOME CMP 720 (Medium Term)After correction stock trading at very important level> Respecting as support on at horizontal and trendline.Risk Reward also looking favorable .Add this to your watchlist and see how it perform in coming days.

Review and plan for 25th April 2025 Nifty future and banknifty future analysis and intraday plan.
Quarterly results.
This video is for information/education purpose only. you are 100% responsible for any actions you take by reading/viewing this post.
please consult your financial advisor before taking any action.
----Vinaykumar hiremath, CMT

CANFINHOME--Near Its DemandZoneThis stock is now approaching a significant demand zone,after a long time.
Price taken the trendline liquidity as well
Price also taken the horizontal liquidity below 700 levels.
We have a clear demand Zone lies at 570-550 levels.
This is the place We have to look for investment in this stock.
Look for investment point of view for longside for the targets of 800 and 1000 levels.
If possible price may take all the trendline liquidity also,go for longs only.

CAN FIN HOMES LTD Bullish Gartley Analysis Details
Instrument: CAN FIN HOMES LTD (NSE)
Timeframe: 1 Hour (1H)
Pattern: Bullish Harmonic Pattern
XA Leg: The initial upward movement defining the trend.
AB Leg: Retracement to 0.357 Fibonacci level.
BC Leg: A minor upward correction reaching 0.884 Fibonacci.
CD Leg: Completion at the 2.674 Fibonacci extension, forming the potential reversal zone (PRZ).
Key Zones:
Potential Reversal Zone (PRZ): Around ₹721 - ₹723.
Target 1: ₹741.80 (highlighted in green with an arrow).
Trade Setup:
Entry: Near the PRZ (₹721 - ₹723), where the harmonic pattern completes.
Stop-Loss: Below ₹716.70 (the recent low).
Target: ₹741.80 (indicated as the first target level).
Indicators:
Fibonacci retracement and extension levels are used to confirm harmonic ratios.
Market is in a corrective phase, making this a probable reversal zone for bullish traders.
Caution:
Ensure confirmation signals (e.g., bullish candles, RSI divergence, or volume spike) before entering the trade.

Wait for Breakout.....NSE:CANFINHOME trade at 880. Support is at 800. Resistance at 930.
You can watch it after breakout as a next resistance at 1100-1150

Can Fin Homes Ltd. - Weekly Chart AnalysisThis weekly chart of Can Fin Homes Ltd. indicates a strong potential for an upward move as the stock approaches a key resistance level with bullish momentum. The setup highlights the following trade parameters:
Entry: Around 876.00 INR
Target: 1,023.40 INR (Potential upside: 16.83%)
Stop Loss: 828.00 INR (Potential downside: 5.49%)
Risk/Reward Ratio: Approximately 3.07:1
Can Fin Homes Ltd. is trading within a symmetrical triangle pattern, which is generally seen as a continuation pattern. The breakout above the upper trendline, accompanied by increased volume, signals potential bullishness. The Fibonacci extension levels suggest a strong resistance around 1,023.40 INR, aligning with the previous high. This trade setup offers a favorable risk/reward ratio, making it an attractive opportunity for traders eyeing a breakout in the medium term.

CAN FIN HOMES LTDSupport and Resistance Levels:
Support Levels: These are price points (green line/share) where a downward trend may be halted due to a concentration of buying interest. Imagine them as a safety net where buyers step in, preventing further decline.
Resistance Levels: Conversely, resistance levels (red line/shade) are where upward trends might stall due to increased selling interest. They act like a ceiling where sellers come in to push prices down.
Breakouts:
Bullish Breakout: When the price moves above resistance, it often indicates strong buying interest and the potential for a continued uptrend. Traders may view this as a signal to buy or hold.
Bearish Breakout: When the price falls below support, it can signal strong selling interest and the potential for a continued downtrend. Traders might see this as a cue to sell or avoid buying.
20 EMA (Exponential Moving Average):
Above 20 EMA: If the stock price is above the 20 EMA, it suggests a potential uptrend or bullish momentum.
Below 20 EMA: If the stock price is below the 20 EMA, it indicates a potential downtrend or bearish momentum.
Disclaimer:
I am not a SEBI registered. The information provided here is for learning purposes only and should not be interpreted as financial advice. It's important to remember that while these indicators can be useful, they are not foolproof. Always consider the broader market context and consult with a qualified financial advisor before making any investment decisions.

weekly chart of CanfinhomeConsolidation for a long-time stock has given breakout 860 range tgt of 950-1000 levels for short to medium term.

Can fin home daily chart breakout @ 860 We can see 950-100 levels soon chart looking good for the short to medium term.

CANFIN HOMES S/R Support and Resistance Levels: In technical analysis, support and resistance levels are significant price levels where buying or selling interest tends to be strong. They are identified based on previous price levels where the price has shown a tendency to reverse or find support.
Support levels are represented by the green line and green shade, indicating areas where buying interest may emerge to prevent further price decline.
Resistance levels are represented by the red line and red shade, indicating areas where selling pressure may arise to prevent further price increases. Traders often consider these levels as potential buying or selling opportunities.
Breakouts: Breakouts occur when the price convincingly moves above a resistance level (red shade) or below a support level (green shade). A bullish breakout above resistance suggests the potential for further price increases, while a bearish breakout below support suggests the potential for further price declines. Traders pay attention to these breakout signals as they may indicate the start of a new trend or significant price movement.
Disclosure: I am not SEBI registered. The information provided here is for learning purposes only and should not be interpreted as financial advice. It is important to consult with a qualified financial advisor before making any investment decisions. Tweets neither advice nor endorsement.

CANFIN HOMES S/RSupport and Resistance Levels: In technical analysis, support and resistance levels are significant price levels where buying or selling interest tends to be strong. They are identified based on previous price levels where the price has shown a tendency to reverse or find support.
Support levels are represented by the green line and green shade, indicating areas where buying interest may emerge to prevent further price decline.
Resistance levels are represented by the red line and red shade, indicating areas where selling pressure may arise to prevent further price increases. Traders often consider these levels as potential buying or selling opportunities.
Breakouts: Breakouts occur when the price convincingly moves above a resistance level (red shade) or below a support level (green shade). A bullish breakout above resistance suggests the potential for further price increases, while a bearish breakout below support suggests the potential for further price declines. Traders pay attention to these breakout signals as they may indicate the start of a new trend or significant price movement.
Disclosure: I am not SEBI registered. The information provided here is for learning purposes only and should not be interpreted as financial advice. It is important to consult with a qualified financial advisor before making any investment decisions. Tweets neither advice nor endorsement.

can finance looking bullish near resistance near resistance can give a breakout target can be all time high 900. breakout can be huge as consolidating since one year
also can reverse from here till 700
keep on radar lets see what happens.

CANFINHOME Finance Multiyear BreakoutCANFINHOMME Finance broke out of multiyear range and seems strong for a good upmove

CANFIN Homes is ready to make a new highThis stock is trading with steady volumes on the bourses in all time frames.
Similarly, it shows positive divergence on oscillators.
The 52W H/L is INR 909.80 / 508.55.
It is consistently making Higher Highs and Higher Lows.
It honoured its support level.
LTP on NSE on 08/Feb/2024 was INR 813.30 (with a high of INR 857.80)
Resultantly after all this discussion, I believe that the target price should be INR 950-1,100.
Stop Loss should be INR 721
Risk to Reward will be 1:3
The time horizon should be 6-9 months


Canfinhome ready for B.OAfter a nice consolidation, Canfinhome can give a possible up move with a decent stoploss and good Targets and if it breaks on the upside one can go long
ENTRY - 798
STOPLOSS - 790
TARGETS - 830, 860, 900++
Note- if any trade or value that's gone from the marked levels then that's not our trade just let it go or wait for it to come back
I'm not sebi registered this is my personal view
Please like or boost my idea if you like it or traded it
Thankyou

#canfinhome Exciting times for CanHome stock! With positive indicators and potential growth on the horizon, the future looks promising. Keep a close eye on this one - could be on the upswing! #CanHome #StockWatch #InvestingOpportunity #BullishTrends

CANFIN HOMESAfter a long sideways stock breakout with good volume
Chart set-up very good for swing long trade.
MACD Bullish crossover
RSI indicate Bullish
Disclaimer This is my personal view for education purpose only
No Buy sell recommendations.

CANFIN Homes technical AnalysisThe stock has consolidated well at resistance level and looks set for a breakout. It has made a beautiful cup and handle pattern as well. Keep a stop below 690 and buy above 800 levels.
Disclaimer- Only for learning purpose.

CANFIN HOMES ANALYSISPleasure to have you here. This is an investment analysis done for the Tickr, and potential in the Technicals.
In this Daily Chart , the chart has been slightly in uptrend and as soon as it crosses its resistance, we will decide to make a position in the stock,
if you like the idea please like the post :) It will be a motivation to further such ideas.
Disclaimer Note:-
1) This is just an analysis setup and no advice to trade/trade
2) If you are making position, please have your risk to reward analysis and then enter.
3) The analysis and target shared does not mean i trade in them, entry and exit depends on the market open and other factors.

CANFINHOME ready for 820 & further 900 levels...#holdcompleted its retracement and ready to move for 815-820 levels in short term and 900 levels from short to mid term. # Good results posted
