Century Plyboards: Long Positional Trade IdeaCentury Plyboards: Long Positional Trade Idea 🚀
Technical Setup:
Century Plyboards has shown a strong breakout above ₹860, reclaiming key resistance levels with good volume support.
The stock has formed a higher-high, higher-low pattern, confirming bullish momentum.
Entry Point:
Ideal entry above ₹865 for confirmation of the breakout.
Stop Loss:
Place a stop loss at ₹800 to manage risk effectively.
Target Levels:
Target 1: ₹925
Target 2: ₹975
Indicators:
RSI at 64 indicates strong bullish momentum without being overbought.
Short-term moving averages are aligned positively, indicating a continuation of the uptrend.
Risk/Reward:
Favorable with a strong breakout and volume confirmation.
Note: Monitor price action near ₹925, as it could act as a resistance zone.
#CenturyPlyboards #StockMarket #PositionalTrade #TradingIdeas
CENTURYPLY trade ideas

CENTURYPLY Seen an Upside Swing Move...CENTURYPLY made a triangle pattern. and give a breakout above 750. You can watch for a Swing move. Next Resistence is at 1000...

CENTURYPLY CMP 750CENTURYPLY cmp 750 giving a signal for trendline breakout with bollinger upper pand breakout.It consolidating from till this year. Add to your wachlist and find best risk reward levels with propper stoploss.

50 SMA Rising- Positional TradeDisclaimer: I am not a Sebi registered adviser.
This Idea is publish purely for educational purpose only before investing in any stocks please take advise from your financial adviser.
Its 50 SMA Rising Strategy. Suitable for Positional Trading Initial Stop loss lowest of last 2 candles and keep trailing with 50 days SMA if price close below 50 SMA then Exit or be in the trade some time trade can go for several months.
Be Discipline because discipline is the Key to Success in the STOCK Market.
Trade What you see not what you Think

CENTURY PLY S/RSupport and Resistance Levels:
Support Levels: These are price points (green line/shade) where a downward trend may be halted due to a concentration of buying interest. Imagine them as a safety net where buyers step in, preventing further decline.
Resistance Levels: Conversely, resistance levels (red line/shade) are where upward trends might stall due to increased selling interest. They act like a ceiling where sellers come in to push prices down.
Breakouts:
Bullish Breakout: When the price moves above resistance, it often indicates strong buying interest and the potential for a continued uptrend. Traders may view this as a signal to buy or hold.
Bearish Breakout: When the price falls below support, it can signal strong selling interest and the potential for a continued downtrend. Traders might see this as a cue to sell or avoid buying.
20 EMA (Exponential Moving Average):
Above 20 EMA(50 EMA): If the stock price is above the 20 EMA, it suggests a potential uptrend or bullish momentum.
Below 20 EMA: If the stock price is below the 20 EMA, it indicates a potential downtrend or bearish momentum.
Trendline: A trendline is a straight line drawn on a chart to represent the general direction of a data point set.
Uptrend Line: Drawn by connecting the lows in an upward trend. Indicates that the price is moving higher over time. Acts as a support level, where prices tend to bounce upward.
Downtrend Line: Drawn by connecting the highs in a downward trend. Indicates that the price is moving lower over time. It acts as a resistance level, where prices tend to drop.
RSI: RSI readings greater than the 70 level are overbought territory, and RSI readings lower than the 30 level are considered oversold territory.
Combining RSI with Support and Resistance:
Support Level: This is a price level where a stock tends to find buying interest, preventing it from falling further. If RSI is showing an oversold condition (below 30) and the price is near or at a strong support level, it could be a good buy signal.
Resistance Level: This is a price level where a stock tends to find selling interest, preventing it from rising further. If RSI is showing an overbought condition (above 70) and the price is near or at a strong resistance level, it could be a signal to sell or short the asset.
Disclaimer:
I am not a SEBI registered. The information provided here is for learning purposes only and should not be interpreted as financial advice. Consider the broader market context and consult with a qualified financial advisor before making investment decisions.

Century ply bourd (I) on 2008 High to break out with high volumeLast time in 2008 global crisis this stock on all time high and now after 16 years price is on same High level. If break this all time high then a Big really come. This time to focus on this stock name century ply bourd (i).

CENTUARY PLY - Moving out of the Accumulation Zone. The stock has finally moved out of the consolidation zone. Late last December, the stock met with price rejection around 850 levels and it was pushed down below the 200 DMA levels. Then it started consolidating for almost three months now. The money flow had started increasing for the past month and the relative strength also started showing signs of recovery. Today, the stock moved out of the consolidation zone with a gap-up opening and a widespread up-bar. Of course, it did meet some supply. as we can see, the close was almost in the upper mid of the bar. The stock also moved above the short-term and the long-term moving averages and we can see the convergence of the averages as well. The relative strength also is moving into the positive territory. The volume has also started increasing and we can see increase in delivery volumes as well. The momentum has been positive for almost a month now. Looks like the stock is now poised to test the rejection zone at 850 again. However, we need to see some increase in the relative strength and the momentum as well. There is also a possibility of a retest of the accumulation zone.

10 percent each month from now for next 2 and half monthHere is a SWOT analysis of Century Plyboards (India) Limited:
Strengths:
1. Strong brand recognition: Century Ply is one of the leading and most recognized plywood brands in India.
2. Diversified product portfolio: The company offers a wide range of plywood, laminates, and other wood-based products to cater to diverse customer needs.
3. Extensive distribution network: Century Ply has a vast distribution network with over 30,000 dealers and retailers across India.
4. Experienced management team: The company has an experienced management team with expertise in the wood-based industry.
5. Backward integration: The company has its own manufacturing facilities, which ensures supply chain efficiency and quality control.
Weaknesses:
1. Dependence on raw material availability: The availability and prices of key raw materials like timber, veneer, and chemicals can impact the company's profitability.
2. High working capital requirements: The plywood industry is working capital-intensive, which can put pressure on the company's liquidity.
3. Exposure to regulatory changes: The company's operations are subject to various government regulations, which can affect its business.
Opportunities:
1. Growing demand for wood-based products: The increasing urbanization, rising disposable incomes, and growing construction activities in India are driving the demand for plywood and other wood-based products.
2. Expansion into new product segments: The company can explore opportunities to diversify into related product segments like furniture, flooring, and other value-added wood-based products.
3. Increasing focus on sustainability: The company can capitalize on the growing trend of eco-friendly and sustainable wood-based products.
4. Expansion in international markets: Century Ply can explore opportunities to expand its presence in international markets, especially in developing countries.
Threats:
1. Intense competition: The plywood industry in India is highly competitive, with the presence of several organized and unorganized players.
2. Substitution threat: The availability of alternative materials, such as MDF, laminates, and particle boards, can pose a threat to the demand for plywood.
3. Volatility in raw material prices: Fluctuations in the prices of key raw materials can impact the company's profit margins.
4. Changing consumer preferences: Changes in consumer preferences towards more eco-friendly and innovative wood-based products may require the company to adapt its product offerings.
Overall, Century Plyboards (India) Limited has a strong market position and growth potential, but it also faces challenges related to raw material availability, working capital management, and competition from substitutes.
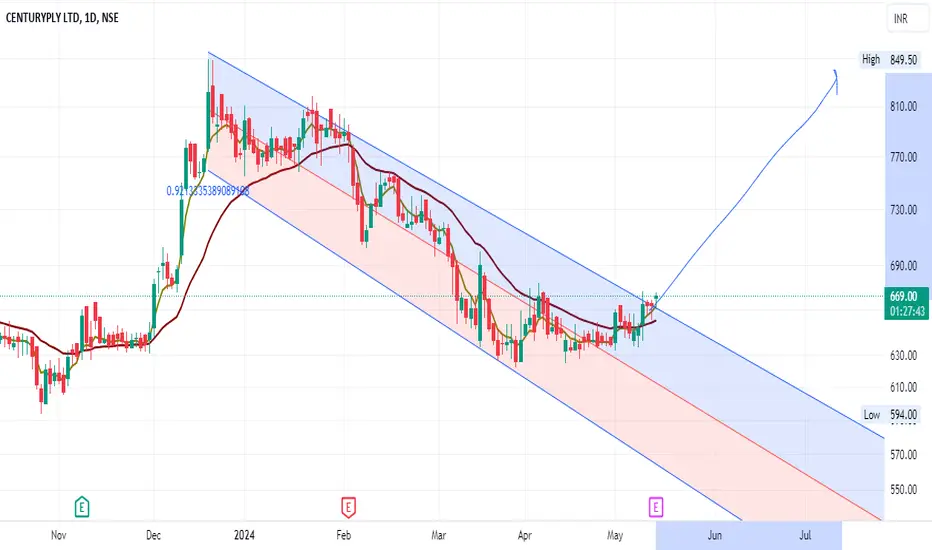
spot 669 targe 825 duration 90 days next from today 15 may 2024
CenturyPly (CENTURYPLY) - Potential Upside This TradingView idea analyzes CenturyPly (CENTURYPLY) on the NSE and explores its potential for growth in two scenarios, incorporating pivot point data for additional insights.
Company Financials:
• Market Cap: ₹ 14,820 Cr (as of December 2024)
• Current Price: ₹ 667
• P/E Ratio: 41.0 (below industry average)
• Book Value: ₹ 93.3
• OPM (Operating Profit Margin): 14.4%
• EPS (Earnings Per Share): ₹ 16.3
Scenarios and Target Prices:
• Scenario 1: Assuming OPM of 15.75% and EPS of ₹20.97, the target price could be around ₹790.
• Scenario 2: Assuming OPM of 14.91% and EPS of ₹18.27, the target price could be around ₹565.
Technical Analysis:
• The stock is currently trading below its key moving averages (SMA-30, SMA-50, SMA-100, SMA-200).
• The RSI and MFI are in the mid-range, indicating no clear overbought or oversold signal.
• The MACD indicator is below the signal line and center line, suggesting potential downward momentum.
Pivot Points:
• First Resistance: 683.1
• Second Resistance: 699.2
• Third Resistance: 713.6
• First Support: 652.7
• Second Support: 638.3
• Third Support: 622.2
Overall, this idea suggests that CenturyPly has potential for upside based on its historical financials and potentially improving margins. The pivot points can be used to identify potential breakout or breakdown levels.
However, the technical analysis still indicates some short-term weakness.
Here are some additional points to consider:
• Debt levels (₹ 483 Cr)
• Industry trends and future growth prospects
• Recent earnings reports and company news
• Broker analyst recommendations
Disclaimer: This is for informational purposes only and should not be considered financial advice. Please consult with a financial professional before making any investment decisions


CENTURYPLYWe have a breakout in Centuryply, volumes has been very good for the last 2 weeks. Traders should look for long opportunities in the stock till the stock trades above 710.
Buying range - 710-750

CENTURY PLY SWING TRADE IDEACENTURY PLAY gave weekly resistance zone as well as head and shoulders chart pattern neck zone breakout with gud volume bar and strong bullish candle along side with hidden trend line and trend line can play for swing as per your RR.

CENTURY PLY – Poised to move higher?Almost six months of consolidation. Now moved out of the consolidation zone with volume support. The Relative strength is turning positive. Money flow and buying pressure is also positive adding to the strength. Increased delivery-based buying is also seen.
Interestingly, in the weekly TF we can see a nice volatility contraction pattern, making the probability of up move higher. However, 744 is a last point of supply on the weekly TF.
Once the stock moves above 744 it will move much higher. The probability of that happening is quite High. A stock to track.

Century Ply Ltd at ATH!Century Ply today made an all time high of 750
The volumes are also looking good
Buy at current market price
Target 1 - 790
Target 2 - 850
Target 3 - 940
Stoploss - 595

CenturyPly Positional Pick LongCenturyPly
Buy Above 747
Keep Sl 423
For target 800-853-959-1091-1224
Time frame 3-4 months
Fundamentally Ok no issue
Currently trading with strong Volume+ Sector also in demand

century plyboards looking bullish the script is showing strength, touched 52 week high and retested back, looking bullish for targets of 750-800+ in future.

CENTURYPLY DTFtrendline breakout and retest done. wait for the high to break and decide your trade. Thank you.

Cup with handle formation in daily chart Century Plyboards India Ltd was incorporated in January 1982 by Mr. Sajjan Bhajanka and Mr. Sanjay Agarwal. The company has a diversified portfolio & manufactures plywood, veneer, laminates, medium density fibre (MDF), particle board and allied products.
Profit is increasing YoY.

CENTURYPLY - Bullish ConsolidationNSE: CENTURYPLY is closing with a bullish consolidation candle supported with volumes.
Today's volumes and candlestick formation indicates strong demand and stock should move to previous swing highs in the coming days.
The stock has been moving along the horizontal support for the past few days which is indicating demand.
One can look for a 8% to 12% gain on deployed capital in this swing trade.
The view is to be discarded in the event of the stock breaking previous swing low.
#NSEindia #Trading #StockMarketindia #Tradingview #SwingTrade
Disclaimer:
This is for educational purposes only.

Short term view Centuryply ltd buy above 535 Short term view
Centuryply ltd buy above 535 (Need to sustain above the level with good candle)
Charts for Educational purposes only
Please follow strict risk reward and stop loss if you follow my level
Thanks,
V Trade Poin

Century ply breakout expectation for short termCentury ply view
535 above if sustain then hope for bulls in short time frame
Charts for Educational purposes only.
Please do follow strict stop loss and risk reward if you follow my level
Thanks,
V Trade Point

CENTURYPLY weekly short type 1 confidence entryCENTURYPLY weekly short type 1 confidence entry
take entry if it retraces ..but not reacted from any stronger opposite demand zone
BTW, stock already broaken its M/W demand...so lees risk

CENTURYPLY#CENTURYPLY is currently trading at important Support level and managed to bounce from the 38,2% Fibonacci level
