CHEMPLAST SANMAR LTD - Weekly Analysis🔍 Summary:
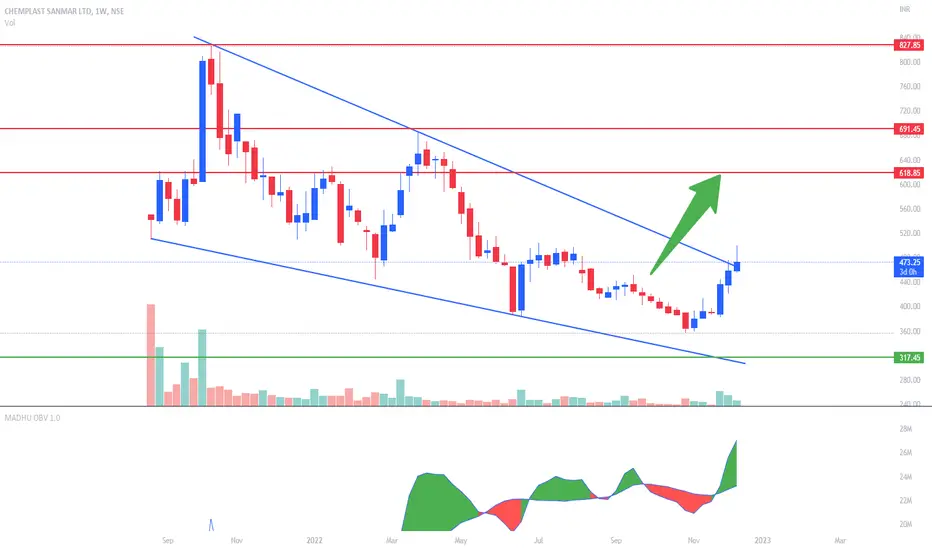
Chemplast Sanmar has been in a prolonged downtrend after peaking near ₹750. Price recently respected key Fibonacci retracement zones and horizontal support near ₹420. Currently, it is attempting to break a falling trendline, with RSI also showing early signs of strength.
🔍 Technical Breakdown:
Trend: Downtrend since July 2023 with consistent lower highs.
Support Zone: ₹420–₹410 (well tested multiple times)
Resistance Zone: ₹450–₹460 (confluence of horizontal and falling trendline)
Fibonacci Levels: Key retracement at 0.786 (~₹420) has held.
Fibonacci Extension: 1.618 level projects target near ₹843 (only on strong reversal).
RSI (14): Currently at 47.38, slightly below 50 but showing a breakout above the RSI trendline.
Volume: Moderate, but increasing near support – a sign of accumulation.
⚠️ Observations & Mistakes to Avoid:
RSI divergence and breakout from RSI downtrend line is bullish, but confirmation on price is still pending.
Volume hasn't spiked significantly yet – wait for volume confirmation before large position.
The downtrend line is still intact on price – do not pre-emptively assume breakout.
✅ Suggestions:
Breakout Watch: A weekly close above ₹455–₹460 with volume will confirm breakout from the falling wedge pattern.
Risk Management: Stop loss for long positions below ₹410 on weekly closing basis.
Upside Targets (Post Breakout):
₹490 (Initial target)
₹530 (Fibonacci resistance)
₹590+ (Medium-term)
Avoid Fresh Shorts unless price breaks and closes below ₹410.
📌 Conclusion:
Chemplast Sanmar is at a decisive juncture. A breakout from the falling trendline with volume could initiate a trend reversal. RSI is improving, and horizontal support has held well. Keep it on radar for potential breakout entry
CHEMPLASTS trade ideas

CHEMPLASTSPrice is taking support of trend line so now it's near support area possible
chances that it will move upper side
This idea is for Educational purpose and paper trading only. Please consult your financial advisor before investing or making any position. Facts or Data given above may be slightly incorrect. We are not SEBI registered

ChemplastsPrice is taking support of trend line so now it's near support area possible
chances that it will move upper side
This idea is for Educational purpose and paper trading only. Please consult your financial advisor before investing or making any position. Facts or Data given above may be slightly incorrect. We are not SEBI registered

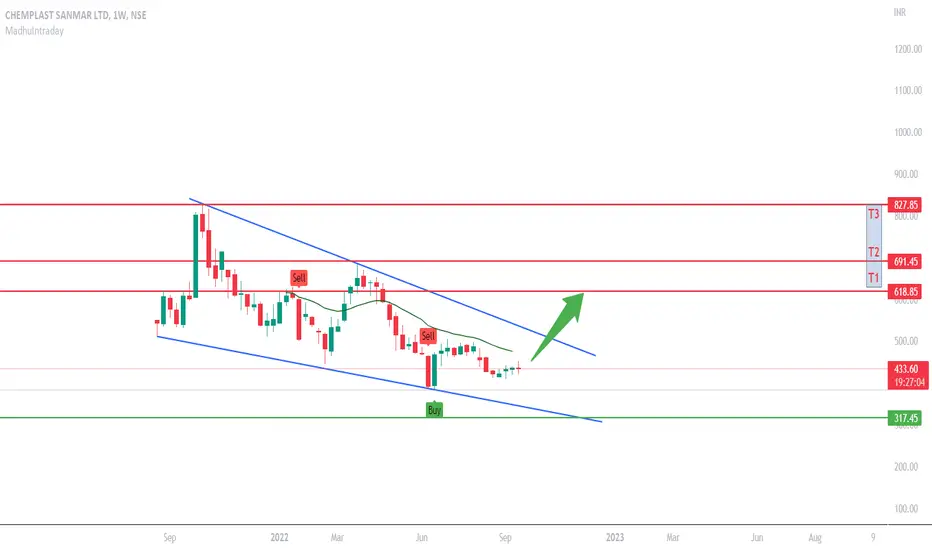
Key Support / Resistance Strategy - Swing TradeDisclaimer: I am not a Sebi registered adviser.
This Idea is publish purely for educational purpose only before investing in any stocks please take advise from your financial adviser.
Key Support & Resistance Breakout. Stock has give Breakout of Resistance level. Keep in watch list. Buy after the Breakout only. Suitable for Swing Trade. Stop loss & Target Shown on Chart.
Be Discipline because discipline is the Key to Success in the STOCK Market.
Trade What you see not what you Think

vcp on chemplastTightening from left to right within the base: You want to see multiple contractions, at least two, within the base.
Relative strength and accumulation signs: Watch for these signs before this price base and within the overall pricing structure.
Volume dry-ups and bursts upwards within the base: On the downtrends within the base, you want to see declining volume. From left to right, you want to see a downward trend line in terms of volume until that pivot point where you want to see a surge upwards in volume.
A very tight last contraction: Ideally, this should be less than 10% from the prior high to that low of that contraction. This shows that the sellers have really dried up and the stock is ready to make a large directional move if that demand comes in as shown by the volume.
How to Catch a VCP Breakout
Catching a Volatility Contraction Pattern (VCP) breakout can be a game-changer in your trading strategy. Here are the steps to effectively catch a VCP breakout:
Identify Candidates: The first step is to identify potential candidates for a VCP breakout. This should ideally be done when the market is closed, allowing you to analyze the market without the pressure of real-time changes.
Set Alerts: Once you have identified potential candidates, set alerts at price levels right below the proper pivot point. These alerts will notify you when the price reaches a certain level, allowing you to act quickly when a breakout occurs.
Plan Your Trades: Planning your trades in advance is crucial. This includes determining your stop loss position sizing. A stop loss order is an order placed with a broker to buy or sell a stock once it reaches a certain price, helping you limit your loss on a stock.
Look for Large Volume: On the breakout, you want to see very large volume. Large volume indicates strong investor interest and can be a sign of a start of a new trend. Look for above-average volume as it pushes through the pivot point.
Execute the Trade: Once the stock pushes through the pivot point on high volume and early on in the day, it's time to execute the trade. This is all about timing and acting quickly to take advantage of the breakout.
Remember, catching a VCP breakout involves careful planning, quick action, and constant monitoring of the market. With these steps, you can effectively catch a VCP breakout and potentially achieve significant returns.

CHEMPLAST looking good for short Term.CHEMPLAST has given a successful weekly breakout above 52 week high and range breakout. And has taken retest, bounce back is expected in it. Keep an eye on it.

Chemplast Sanmar- Nice BreakoutChemplast Sanmar- Nice Breakout
Capital to be deployed- 20k
Investing Price -610-620
Breakout Price -609
Stoploss -547
Targets -792-875
#chemplastsanmar #StockMarketindia #StockToWatch #StocksInFocus #stockstowatch #StocksToTrade

CUP-HANDLE IN MAKING- CHEMPLASTCHEMPLAST - A CUP & HANDLE IS IN MAKING. Explained in stock. A chemical play.

chemplastDirectorate General of Trade Remedies (DGTR) initiates anti-dumping investigation concerning imports of poly vinyl chloride (PVC) suspension resins originating in or exported from China, Indonesia, Japan, South Korea, Taiwan, Thailand and U.S.
** Applications seeking anti-dumping probe filed by DCW, DCM Shriram and Chemplast Sanmar, alleging dumping of PVC resins, according to DGTR
** DCW, DCM Shriram and Chemplast are the major domestic producers of PVC resins

Chemplastis a major manufacturer of Speciality Chemicals such as Specialty Paste PVC resin and Custom Manufactured Chemicals for agro-chemical, pharmaceutical and fine chemicals sector. The company also produces other chemicals such as Caustic Soda, Chlorochemicals, Hydrogen Peroxide, Refrigerant gas and Industrial Salt. The manufacturing facilities are located at Mettur, Berigai and Vedaranyam in Tamil Nadu and Karaikal in the Union Territory of Puducherry.

chemplast 1w time frame buy @ 493 target @ 539, 549, 561.95 chemplast 1w time frame
buy @ 493 target @ 539, 549, 561.95
channel breakout
risk reward 1.5
its just a view trade @ your own risk
sl@ 445.90

CHEM PLASTIf this candle closes above 500. Then weekly candle will close as elephant candle.
gud break out from range with awsome volume. supported by both key moving average 20& 200 MA.
sl will be 445
target near 700

📈 Exciting Bullish Pattern Alert! 🐂📊 Pattern: Rising Channel
📌 Symbol/Asset: Chemplasts
🔍 Description: Retesting strong Law Of Polarity zone, high probability of bounce back.
👉 Remember: Technical patterns are just one piece of the puzzle. Consider conducting further research, consulting with a financial advisor, and managing your risks appropriately.

Larger the Base Bigger the MoveAfter Strong Down Trend price try to make a base and when price sustain above 500 then we will see a good move

chemplast 1d time frame buy @ 490 target 520,530, 545chemplast 1d time frame
buy @ 490 target 520,530, 545
sl 456.50
risk reward 1.65

📢 New Trade Opportunity: Chemplast Stock Breakout 📈🚀
📉 Chemplast stock has recently experienced a significant 50% decline from its all-time high. However, on the weekly timeframe, the stock has formed a flat channel pattern and successfully broke out of it on the last Friday, signaling a potential bullish move ahead.
💪 This breakout was preceded by a buildup phase, which enhances the likelihood of a successful breakout. Additionally, the stock has witnessed notable volume spikes, indicating increased buying interest, and the Relative Strength Index (RSI) is above 60, suggesting positive momentum in the near term.
📊 Based on these technicals, there appears to be an opportunity to consider opening fresh long positions in Chemplast stock. To manage risk, it is advisable to implement a strict stop loss at 435, which would limit the potential drawdown to 9%. The projected targets for this trade are in the range of 595-665, potentially offering returns of 25% to 40% in the near term.
📌 Stay informed, exercise caution, and may your investment endeavors be rewarding! 💼💰

CHEMPLAST SENMARGood time to accumulate if sustain above 555 level.
Disclaimer - This post is only for educational purpose and do not treat it as a trading recommendation.

CHEMPLAST - UPDATEKey product segments
Suspension PVC
- 67% of 9MFY22 revenue (vs 66% in FY21)
Specialty chemicals
- 21% of 9MFY22 revenue (vs 24% in FY21)
Non-specialty chemicals
- 12% of 9MFY22 revenue (vs 10% in FY21)
Breakout in charts - can be added for longterm , targets marked in chart.
Market Cap
₹ 7,440 Cr.
Current Price
₹ 471
High / Low
₹ 685 / 357
Stock P/E
12.4
Book Value
₹ 113
Dividend Yield
0.00 %
ROCE
51.1 %
ROE
51.3 %
Face Value
₹ 5.00
Promoter holding
55.0 %
EPS last year
₹ 41.0
EPS latest quarter
₹ 2.44
Debt
₹ 925 Cr.
Pledged percentage
0.00 %
Net CF
₹ 696 Cr.
Price to Cash Flow
8.26
Free Cash Flow
₹ 849 Cr.
OPM last year
20.3 %
Reserves
₹ 1,705 Cr.
Price to book value
4.18
Int Coverage
6.06
CHEMPLAST- As per the chart one can take long position with mentioned stop loss
- Fundamentally Good company
- Good for Long-term
Buy signal for CHEMPLASTStock price near 52 week low
Bullish Harami in Daily Chart
Bullish Harami in Weekly Chart
Piercing Line in Monthly Chart
Stock price at the lower Bollinger band (weekly chart)
Stock price at the lower Bollinger band ( daily chart )
Sharp rise in RSI on daily chart in RSI
Very Sharp rise(V formation) in RSI on weekly chart
RSI slowly increasing on monthly chart
MACD had a recent golden crossover on daily chart
MACD is possibly having a golden crossover on weekly chart
Pivots bullish in daily chart , bullish in weekly chart and very bullish in monthly
Stock price near 52 week low
Analyst rating is Strong Buy
NSE:CHEMPLASTS

Chemplast Sanmar Ltd. Trend AnalysisHigh probability trade setup.
A potential reverse head & shoulder pattern is forming.
As per price action, expecting a higher low after the higher high formed @ 685 level.
Better to accumulate around 530 levels as it is in confluence with the following:
i) Key support level
ii) Retest of descending channel
iii) At golden FIB level.
iv) Bottom of the pitchfork.
Short term swing target @ 785 (48% ROI with 6.37 R:R)
Medium term positional target @ 1060 (100% ROI with 13.25 R:R)
Keep stop loss @ 490
Do your own due diligence before taking any action.
Peace!!

Buy CHEMPLASTSPRICE ACTION ANALYSIS
Stock Name: CHEMPLAST SANMAR LTD
CMP: 645
1. Why Trade for Quick Swing ⁉️
- Morning Star at Support of 50% Fib Level
- Trendline Breakout with Volume
2. When to Buy❓
- Buy above High of 13th April i.e. above 647
3. What should be my Stop Loss 🔴
- If stock closes below 610 on Daily basis, exit and wait for next trigger!
4. But my view is of mid-term 😬
- In that case, add more around 600 levels, with Strict Stop Loss of 564
5. What should be my Targets 🟢
- If you are holding it for swing, get quick points with T1 of 675 and T2 of 700
6. But I want to hold it for some more time⏳
- Stock is not very much favourable as it has major resistance around 700 levels. Better to see Price action around 700 levels and decide whether to hold or not..
7. Start of Wave 5. Looks like..🤔
- Wave 2 gave a flat correction compared to wave 4
- Wave 4 took support at 50% Fib
- Wave 2 didn't went below 61.8% of Wave 1
8. What is acting against you ‼️
- Risk/Reward is not very much favourable
- No clear picture on Monthly Chart as Stock was listed recently
- Rs. 680 is 61.8% retracement from top for the stock which can act as resistance
So what should be my action plan ?
👉🏻 Trade, Trail and Observe!
Happy Trading! 📈

Chemplasts- BuyChemplast- In Buying Range. A Close below Rs. 620 will be a Stop Loss. Target 1- 670 Rs. , Target-2 750.
