CholaFin nearing weekly supply zoneCholaFin is at its weekly supply zone, it has failed twice to break the same zone.. will it break it this time? Pay attention to the price action here. A strong breakout on closing basis with volume is the key for a successful breakout, followed by a retracement that takes support at the resistance turned support level.
CHOLAFIN trade ideas

Cholafin - Breakout pattern? TARGET Rs. 647 (In next 6 months?)I am entering this stock now with a target of Rs. 647
Profit % expected to be above 85%
What are we talking about?
Breakout
Elliott Wave 3
Target Rs. 647
6 Months or Less

Cholafin { 15 M Short }At Resistance forming Doji in 15 tf .Short will be a good bet here keeping TSL as PCH .

CholaFINI'm not an expert I'm just sharing my views on CHOLAFIN for next trading day
I'm not responsible for any profit or loss this is not a recommendation.

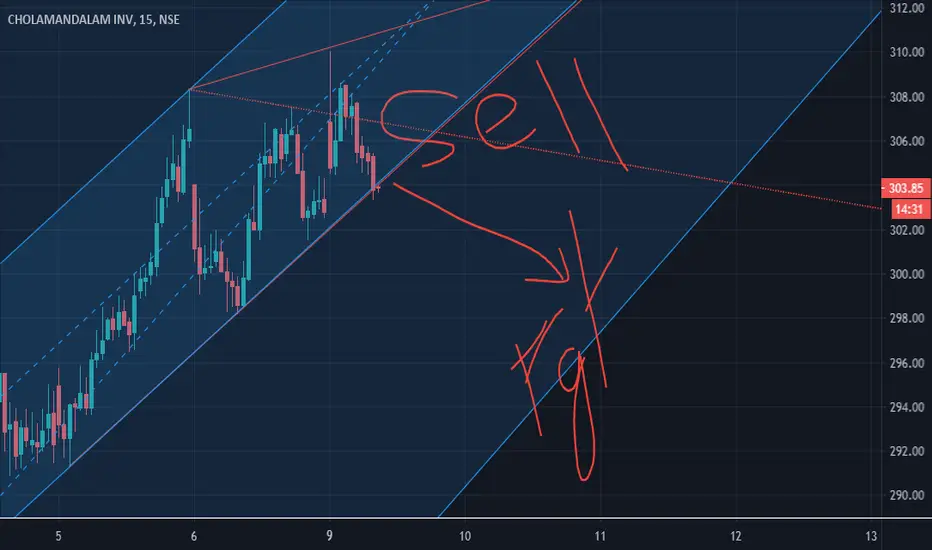
Cholamandalam Finance - ShortCholafin CMP - 312.30
Looking bearish in higher time frame. One can go for Intraday Trade setup with the following entry, exit & targets
Sell at o Below 310 / Stop Loss 316
Target 1 - 307
Target 2 - 305
Target 3 - 302 / 300
Disclaimer: This is my view and for educational purpose only.

cholafin made double top and bearish pattern at the topcholafin made double top and bearish pattern at the top made evening star it can retrace from current level

Heavy RSI divergence in Cholamandalam at a very crucial point RSI divergence is clearly visible in the chart.
hence I would suggest people to be bearish since cholamandalam already gave a breakout and can possibly give a retracement and therefore fulfilling our strategy
please don't short below the red line near 270.
target 1 of near 1.9% can be achieved if cholamandalam starts falling
for people who want to take more risk can book small profits at target 1 and then continue on to target 2
please check market sentiments
a bearish market will add to our idea


CHOLAFIN - Possible short tradeIncase if financial sector is trading weak,
and Cholafin is trading below 247 level - will test 240 before any bounce.
Add to watchlist for possible short trade.

HOW I BOOKED 1.5 % IN CHOLAFINTrade based on
1. trend line support and rss
2. Rsi
3. Fibonaaci
4. Price action


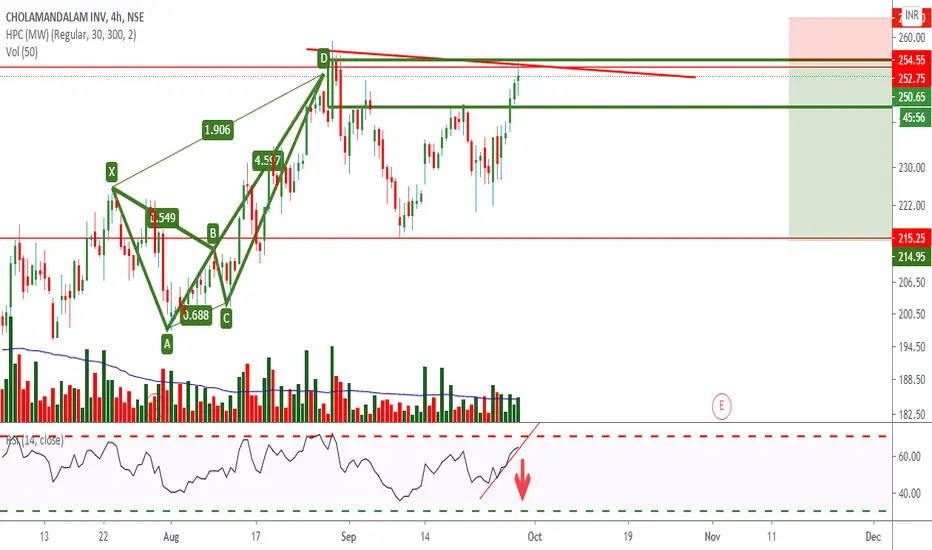
CHOLAFIN 4HRTwo Strong BEARISH Patterns CRAB@1.902XA & Crab @1.61XA Forming Strong POTENTIAL REVERSAL ZONE
price need to follow Green Trend line & hit target
If price Breaks Red Trend line is where EXIT before SL hits
POTENTIAL SELL

CHOLAFIN 1HRBEARISH Crab
price need to follow Green Trend line & hit target
If price Breaks Red Trend line is where EXIT before SL hits
POTENTIAL SELL


Golden crossover observed on Daily levels with a good RSIBuying opportunity seen on daily charts with below positive points:
- Good RSI, showing momentum
- Outperforming Nifty in medium-term
- Golden cross observed, 50 DEMA cross 200 DEMA
And the stock is near a breakout.
A possible target of 307. SL 231.

CHOLAFIN 1HRThree Strong BEARISH Patterns 4HR TF CRAB & 1HF GARTLEY & Butterfly Forming Strong POTENTIAL REVERSAL ZONE ..
Ultra high volume bars - trap of Smart Money , Higher volume- Professionals are selling into the public buying
Price need to follow Green Trend line & hit target
If price Breaks Red Trend line is where EXIT before SL hits
POTENTIAL SELL

CHOLAFIN 4HRBEARISH Crab@1.902XA Earlier this same crab given good reaction on Type1 entry at 1.902XA & hit both Targets
now price when again come into PRZ Zone of Crab it becomes a TYPE2 Entry which is REVERSAL & after getting confirmation with a Bearish candle and RSI below 70 & with LOW VOLUMES then set up becomes valid
POTENTIAL SELL
Cholamandalam Finanace Cholamandalam Finance.
Breaking out today for a first target 260 levels.
Close open above 260 possible for 280 levels.
RSI, Volume, And Stochastic are good numbers.
The fall from 259 to 215 was not supported by volume
And to add had couple of candles with long wick at the bottom indicating good support in buys.
Today the stock is above 9EMA and good candle shape too with little or no wick at top.

