CIPLA trade ideas

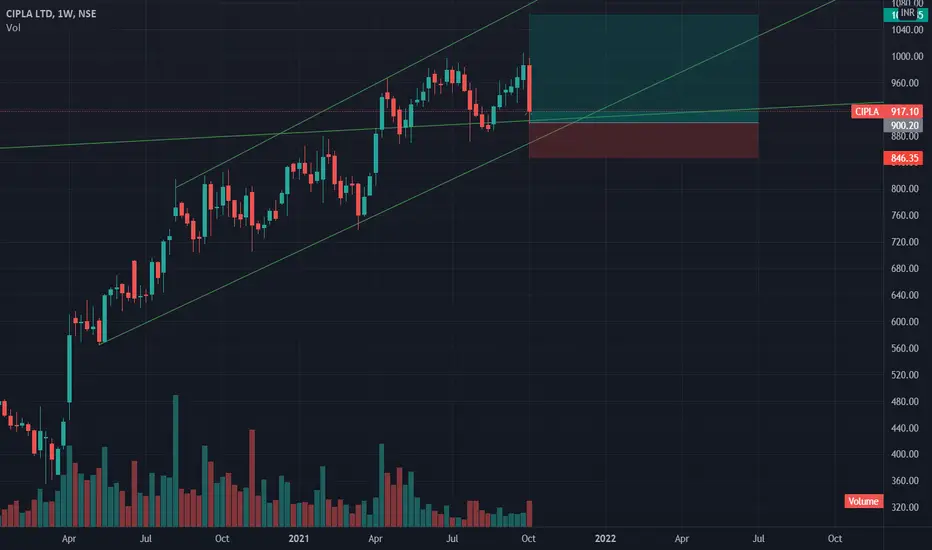
Cipla at a crucial point at 200 DEMACipla weekly chart shows price is at a crucial point just standing on the 200DEMA line.
Stock has been in the range of 873-1006, which currently is at the bottom of the range.
Crucial to hold 200DEMA to move up, if breakdown then may move towards the lower range marked in the chart.
*Only for educational purposes, not a buy/sell recommendation.

[Positional] Cipla Buy Idea SnR BetNote -
One of the best forms of Price Action is to not try to predict at all. Instead of that, ACT on the price. So, this chart tells at "where" to act in "what direction. Unless it triggers, like, let's say the candle doesn't break the level which says "Buy if it breaks", You should not buy at all.
=======
I use shorthands for my trades.
"Positional" - means You can carry these positions and I do not see sharp volatility ahead. (I tally upcoming events and many small kinds of stuff to my own tiny capacity.)
"Intraday" -means You must close this position at any cost by the end of the day.
"Theta" , "Bounce" , "3BB" or "Entropy" - My own systems.
=======
I won't personally follow any rules. If I "think" (It is never gut feel. It is always some reason.) the trade is wrong, I may take reverse trade. I may carry forward an intraday position. What is meant here - You shouldn't follow me because I may miss updating. You should follow the system I share.
=======
Like -
Always follow a stop loss.
In the case of Intraday trades, it is mostly the "Day's High".
In the case of Positional trades, it is mostly the previous swings.
I do not use Stop Loss most of the time. But I manage my risk with options as I do most of the trades using derivatives.
=======

CIPLA - Upward Bullish Trend - Short Term Target 1070-1080CIPLA has been on upwards bullish trend channel, recently it hit the key support trend line and bounced off sharply. I except CIPLA to test the channel upper trend line , with short target of 1070-1080 in next 5-6 weeks. If it breaks above the upper trend line for 2-3 consecutive days, expect a major breakout. But so far it has been in the channel for last 18 months.

Cipla IndiaSun Storm Investment Trading Desk & NexGen Wealth Management Service Present's: SSITD & NexGen Portfolio of the Week Series
Focus: Worldwide
By Sun Storm Investment Research & NexGen Wealth Management Service
A Profit & Solutions Strategy & Research
Trading | Investment | Stocks | ETF | Mutual Funds | Crypto | Bonds | Options | Dividend | Futures |
USA | Canada | UK | Germany | France | Italy | Rest of Europe | Mexico | India
Disclaimer: Sun Storm Investment and NexGen are not registered financial advisors, so please do your own research before trading & investing anything. This is information is for only research purposes not for actual trading & investing decision.
#debadipb #profitsolutions


CIPLA : READY TO GO CIPLA completed pricewise Correction on daily timeframe , timewise correction is Now subjective but Expected to start NEW Run from Current levels....CMP is 895 can go long for target 1080 sl 825 on closing basis

CIPLACIPLA at support if nifty sustain at these levels then it can be a good swing trade. cmp895
22/11/21

Swing Trade CIPLA 3WK - Strong Breakout Targets 951, 964, 980+ Cipla exhibiting strength and has broke 921 and confirmed the mood with breaking 935. Will watch closely for breach of these critical supports for trading.

LONG_CIPLAEntry after the break of 50 EMA in daily time frame
Weekly:
Area of Confluence:
1.Key Support level
2.Trend Line Support
3.50 EMA Support
4.Double Bottom
5.Multiple Candles Rejection
6.Momentum Loss
1D :
Trend Line break


My view on CIPLACipla should give trendline breakout above 925-926.Target looking 935-940-950++ very short term.My SL is below 909.Also keeping on radar Cipla 940 CE.

Price action Support and resistance
In down Trend last candle made bullish harami
It's long opportunity with near support level

CIPLA LTDMust Correlate yourself on charts before taking an entry. This is for Educational purposes only. Please consult your Financial advisor before investing.

Cipla 1hr chart Descending Triangle Breakout 27 Oct 2021Cipla 1hr chart formed Descending Triangle gave a Breakout due to good quarterly results. Expecting a target of 950. 27 Oct 2021

CIPLA WEEKLY CHART Cipla making HH and HL pattern , best buy in 885-890 zone , tgt 915-920 intraday , 940-945 positional

Cipla on 1d TFCipla is at good support levels..once it forms a green candle then we can enter for a good target.
It is just for educational purpose..


cipla both side targetCipla both sides target if the stock has break levels which shows in stock then we will trade

Cipla 1HR Time Frame EMA with Support and Resistance !This is a Simple Strategy with only use of EMA
1. Add 50 and 200 EMA
2. Set Time Frame to 1hr or Your Comfort
3. if 50 EMA Cross above 200 means its a Buy trade !
4. Similarly if 50 Cross Below 200 EMA Means its a Sell Trade !
5. Take Profit is previous support or Resistance or you can use 50 EMA Crossing as a Take Profit also

CIPLA Multi Year Range BreakoutThe stock has broken out with good volumes and retested, so it may undergo a rally. Trade is supported by brokerage calls and Supports Nearby.
Risk Reward Ratio - 3:1
SL is placed below support zone & the previously upper & lower trendline. The target is placed based on fundamentals.
Cipla Slightly bullish Cipla has good enough puts are at 900 and 910 strike price.Expected it moves up from here,
as it's already at over sold zone.

Cipla BuyCIPLA buy based on the SUPPORT AND RESISTANCE
This share is SWING TRADING
Entry 900
Target 990
Stop loss 880
Its my personal view only.
