CIPLA going to hit 790 soon?A strong volume in cash market of CIPLA and technical breakout at 758 level will show a strong quick jump to 790+ in prices.
Looking good for long. Stop loss will be 740.
CIPLA trade ideas

CIPLA READY TO FALLSee chart of 15 mi and 30 in.tf. One by one stochastic starts going below 20. Hourly it is giving clear 123 sell signal.
Just waiting for the 30 min. stochastic to go below 20 and hourly stochastic to fall below 80. This is only technical view and not a trade call.


Is Cipla in Disribution Phase ?According to Price Action Cipla chart had good upstrend and now it is moving in a range 710 - 800 and it is stuck in range for quite long time. If it goes below 700 then it is downtrend will start.
Note: My Analysis is just for education purpose and not recommendation for buy or sell


CIPLAIm not an expert im just sharing my views on CIPLA for tomorrow
Im not responsible for any profit or loss this is not a recommendation

Head and shoulders pattern Only for analysis head and should pattern and
retested too will go down now onwards....

Cipla (A consolidation to continue ?)Cipla has been consolidating in a range for a while now. After trying to breach the 830 zone multiple times it is now again consolidating in that big range of 700-800. An experienced trader can surely look for moves within the structure and for others they would need patience for a breach of the structure before picking up a trade. A lower high formation was seen on the 9th of November, If the same is maintained then a short bias can be created and traded when the breach comes.
Things have started to turn towards the positive side, with many things working in India's favour like Increasing growth forecasts by different brokerage / research houses, companies delivering better than expected numbers for Q2, the expectation of having a vaccine soon has brought the Index to its all time high and things are just looking better. However we need to keep in mind that the markets are going up only on the expectation that things will be better, We need to see that even though the numbers for a lot of companies have improved they are still lagging the previous year on a half yearly basis and might de grow on a yearly basis as well, which clearly shows the valuations getting stretched even further. Volatility is here to stay until things don's look certain.
So trade with caution and never over expose.

CIPLA projected downfallOne can wait for the trendline retest and rejection and enter PE buy position

CIPLA - Rising Wedge/Bear Flag - Intraday/Short TermThis analysis is purely based on price action and Chart Patterns.
The analysis is on 15min TF hence target can be achieved in intraday trade or in couple of days
Trade strategy is explained in image itself. Don't run after the price.
Always plan your trade & trade your plan
Keep trailing SL accordingly once entered into the trade.
Trade at your own risk and money management. Do your own study before taking any trade
Feel free to comment for any queries & suggestion

CIPLA (Bearish H&S Pattern) - Intraday/Very Short TermThis analysis is purely based on price action and Chart Patterns.
The analysis is on 15min TF hence target can be achieved in intraday trade or in couple of days
Trade strategy is explained in image itself. Don't run after the price.
Always plan your trade & trade your plan
Keep trailing SL accordingly once entered into the trade.
Trade at your own risk and money management
Feel free to comment for any queries & suggestion

Cipla 1 Month Chart: India Buy & Hold Cipla 1 Month Chart: India Buy & Hold
A Profit & Solutions Strategy

For Intraday on 9th NovemberCan be sold below 785.0 for Intraday!
Note: I'm not SEBI registered. This post is just for educational purpose.

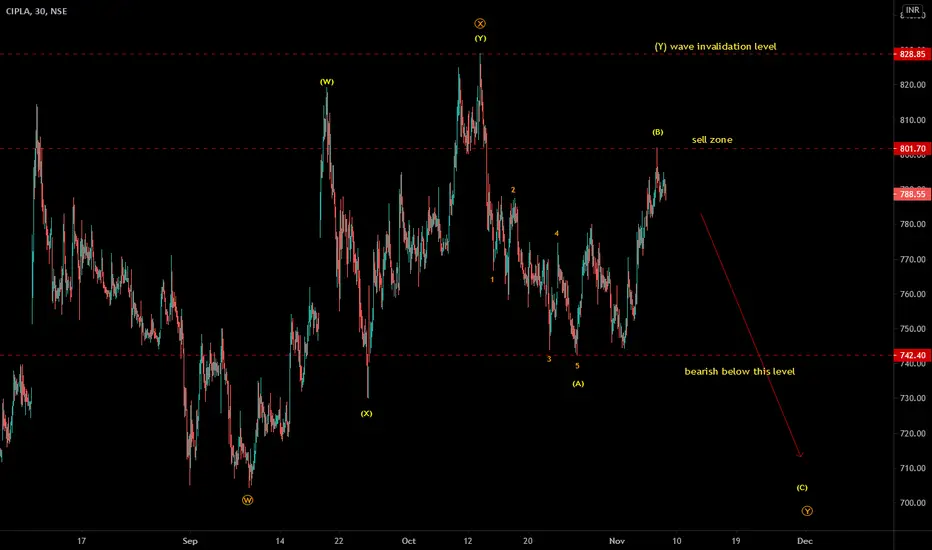
CIPLA - Elliott wave analysis Cipla - It is in C of Y wave down. Sell with stop loss above 829 for C wave for target below 730 to 700 zone.

Cipla shortPerfect intraday setup to sell...retracement from 50 fib levels...confluence with corrective phase during impulse move..heading towards target shown..every up move today will be shorting opportunity

Cipla - Intraday Trade SetupCipla CMP - 762.30
Looking bearish. One can go for Intraday trade setup with the following entry, exit & targets
Buy at or above - 756 - 755 / Stop Loss 764
Target 1 - 750
Target 2 - 745
Target 3 – 740
Disclaimer: This is my view and for educational purpose only.

CIPLA Wave AnalysisCipla - took support at 746 that I have drawn the lower end of the channel to now. The top end has parallel line, one that coincides with 3 previous tops. This gives us two potential outcomes for wave 5 up, either a move to the first line at 875 or the second line at 945. Time will tell which and by when.

