Cipla Target 1700Daily time period analysis . this stock complete one impulse cycle and one corrective and again start new impulse wave = 3rd wave . Wave 3rd maximum time larger wave in impulse wave
CIPLA trade ideas

Cipla Limited Intraday level for 18th July #CIPLA Cipla Limited Intraday level for 18th July #CIPLA
Buying may witness above 1533
Support area 1500. Below ignoring selling momentum
Charts for Educational purposes only.
Please follow strict stop loss and risk reward if you follow the level.
Thanks,
V Trade Point

CIPLA with a Bearish Engulfing PatternCIPLA NSE:CIPLA has a formed a bearish Engulfing Candle and this can go further down.
Target would be 1452 - 1400. Advice is to take minimal profit as we are gaining from Downtrend.

Cipla Intraday level for 15th July #CIPLA
Cipla Intraday level for 15th July #CIPLA
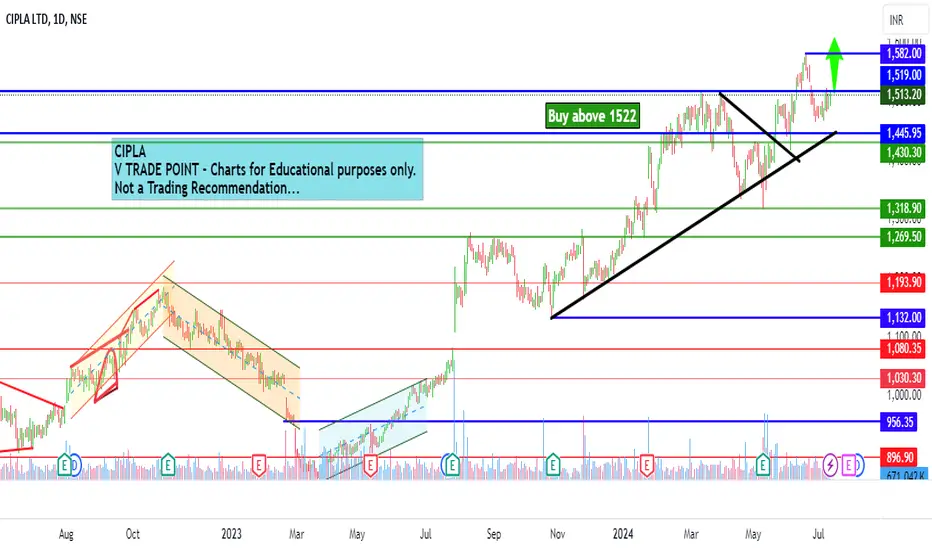
Buying opportunity above 1522
Support area 1500. Below ignoring buying opportunity
Charts for Educational purposes only.
Please follow strict stop loss and risk reward if you follow the level.
Thanks,
V Trade Point

Cipla Intraday level for 12th July #CIPLA Cipla Intraday level for 12th July #CIPLA
Buying opportunity above 1522
Support area 1500. Below ignoring buying opportunity
Charts for Educational purposes only.
Please follow strict stop loss and risk reward if you follow the level.
Thanks,
V Trade Point

Cipla Intraday level for 11th July #CIPLA Cipla Intraday level for 11th July #CIPLA
Buying opportunity above 1522
Support area 1500. Below ignoring buying opportunity
Charts for Educational purposes only.
Please follow strict stop loss and risk reward if you follow the level.
Thanks,
V Trade Point
Cipla Intraday level for 10th July #CIPLA Cipla Intraday level for 10th July #CIPLA
Buying opportunity above 1522
Support area 1500. Below ignoring buying opportunity
Charts for Educational purposes only.
Please follow strict stop loss and risk reward if you follow the level.
Thanks,
V Trade Point

sell at zone ~ intradayexpecting small fall from the zone .
- good for intraday trade
expecting small fall from the zone . look for confirmation inside zone in smaller time frame
ENTRY
- entry is strictly inside the zone
- look for confirmation in smaller time frame ( 15 mins preferred )
TARGET
- use fibonacci retracement on C to latest swing high
- mark 0.236 fib value as target
STOPLOSS
- if daily tf candle close is above the zone .


Cipla - Go LongCipla, A Pharma Giant and leader in Generics with a good profit margin of 12-15% y-o-y has given a All-Time High Break Out and is ready to go above till 1650.

CIPLA S/R Support and Resistance Levels: In technical analysis, support and resistance levels are significant price levels where buying or selling interest tends to be strong. They are identified based on previous price levels where the price has shown a tendency to reverse or find support.
Support levels are represented by the green line and green shade, indicating areas where buying interest may emerge to prevent further price decline.
Resistance levels are represented by the red line and red shade, indicating areas where selling pressure may arise to prevent further price increases. Traders often consider these levels as potential buying or selling opportunities.
Breakouts: Breakouts occur when the price convincingly moves above a resistance level (red shade) or below a support level (green shade). A bullish breakout above resistance suggests the potential for further price increases, while a bearish breakout below support suggests the potential for further price declines. Traders pay attention to these breakout signals as they may indicate the start of a new trend or significant price movement.
Disclosure: I am not SEBI registered. The information provided here is for learning purposes only and should not be interpreted as financial advice. It is important to consult with a qualified financial advisor before making any investment decisions. Tweets neither advice nor endorsement.
Reverse head and shoulder on CIPLACIPLA formed a reverse head and shoulder pattern on a daily chart. One can have stop loss just below previous swing low with target the height of the head. Entry can be held just above todays high provided the same bullishness prevails. This trade offers ideal risk reward of more than 1:2.
Hope you like this idea, if so please boost this idea or leave a comment below on what you think. Otherwise happy trading :-).


stock on radaron daily chart , the stock has formed inverted head & shoulder pattern and close above neckline i.e 1515, would give a good move upside. may keep in radar for upmove.

CIPLA 1DAYEXPECTED GOOD MOVE
.
.
.
.
.
I Am Not SEBI Registered Analyst. All Post and Levels Posting is only for educational and knowledge purpose. I Am not responsible for your any kind of loss or profit.
No Claim, All Rights Reserved.‼️

CIPLA LTD S/RSupport and Resistance Levels: In technical analysis, support and resistance levels are significant price levels where buying or selling interest tends to be strong. They are identified based on previous price levels where the price has shown a tendency to reverse or find support.
Support levels are represented by the green line and green shade, indicating areas where buying interest may emerge to prevent further price decline.
Resistance levels are represented by the red line and red shade, indicating areas where selling pressure may arise to prevent further price increases. Traders often consider these levels as potential buying or selling opportunities.
Breakouts: Breakouts occur when the price convincingly moves above a resistance level (red shade) or below a support level (green shade). A bullish breakout above resistance suggests the potential for further price increases, while a bearish breakout below support suggests the potential for further price declines. Traders pay attention to these breakout signals as they may indicate the start of a new trend or significant price movement.
Disclosure: I am not SEBI registered. The information provided here is for learning purposes only and should not be interpreted as financial advice. It is important to consult with a qualified financial advisor before making any investment decisions. Tweets neither advice nor endorsement.

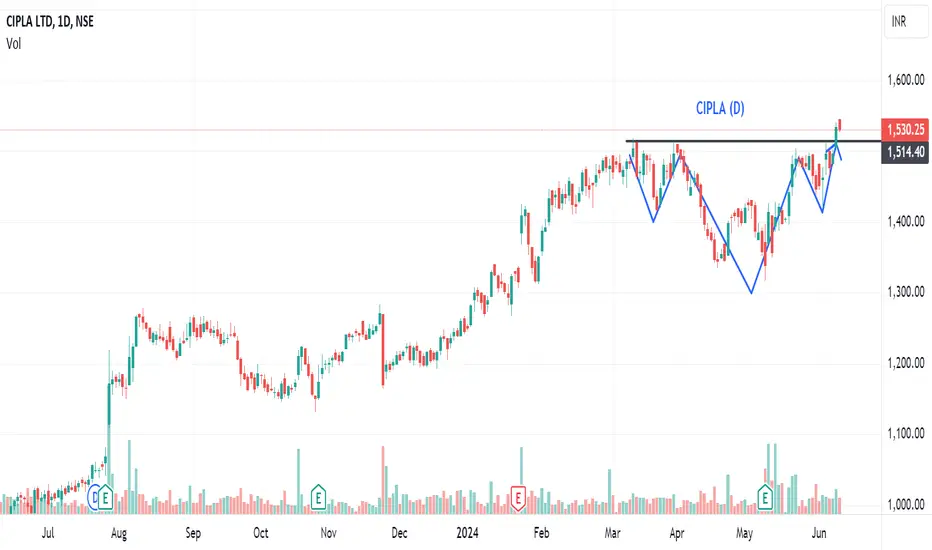
Cipla stock W pattern Hello,again I will give you good opportunity stock in day chart w pattern make if market retest you can buy if not ignore the trade thank you.

CIPLA S/RSupport and Resistance Levels: In technical analysis, support and resistance levels are significant price levels where buying or selling interest tends to be strong. They are identified based on previous price levels where the price has shown a tendency to reverse or find support.
Support levels are represented by the green line and green shade, indicating areas where buying interest may emerge to prevent further price decline.
Resistance levels are represented by the red line and red shade, indicating areas where selling pressure may arise to prevent further price increases. Traders often consider these levels as potential buying or selling opportunities.
Breakouts: Breakouts occur when the price convincingly moves above a resistance level (red shade) or below a support level (green shade). A bullish breakout above resistance suggests the potential for further price increases, while a bearish breakout below support suggests the potential for further price declines. Traders pay attention to these breakout signals as they may indicate the start of a new trend or significant price movement.
Disclosure: I am not SEBI registered. The information provided here is for learning purposes only and should not be interpreted as financial advice. It is important to consult with a qualified financial advisor before making any investment decisions. Tweets neither advice nor endorsement.

CIPLA INTRADAY VIEW FOR 22ND MAYCIPLA INTRADAY VIEW FOR 22ND MAY
Buying opportunity may see above 1452
Support area 1430
Charts for Educational purposes only. Not a Trading recommendation.
Please follow strict risk reward and stop loss.
Thanks
V Trade Point

CIPLA S/R Support and Resistance Levels: In technical analysis, support and resistance levels are significant price levels where buying or selling interest tends to be strong. They are identified based on previous price levels where the price has shown a tendency to reverse or find support.
Support levels are represented by the green line and green shade, indicating areas where buying interest may emerge to prevent further price decline.
Resistance levels are represented by the red line and red shade, indicating areas where selling pressure may arise to prevent further price increases. Traders often consider these levels as potential buying or selling opportunities.
Breakouts: Breakouts occur when the price convincingly moves above a resistance level (red shade) or below a support level (green shade). A bullish breakout above resistance suggests the potential for further price increases, while a bearish breakout below support suggests the potential for further price declines. Traders pay attention to these breakout signals as they may indicate the start of a new trend or significant price movement.
Disclosure: I am not SEBI registered. The information provided here is for learning purposes only and should not be interpreted as financial advice. It is important to consult with a qualified financial advisor before making any investment decisions. Tweets neither advice nor endorsement.
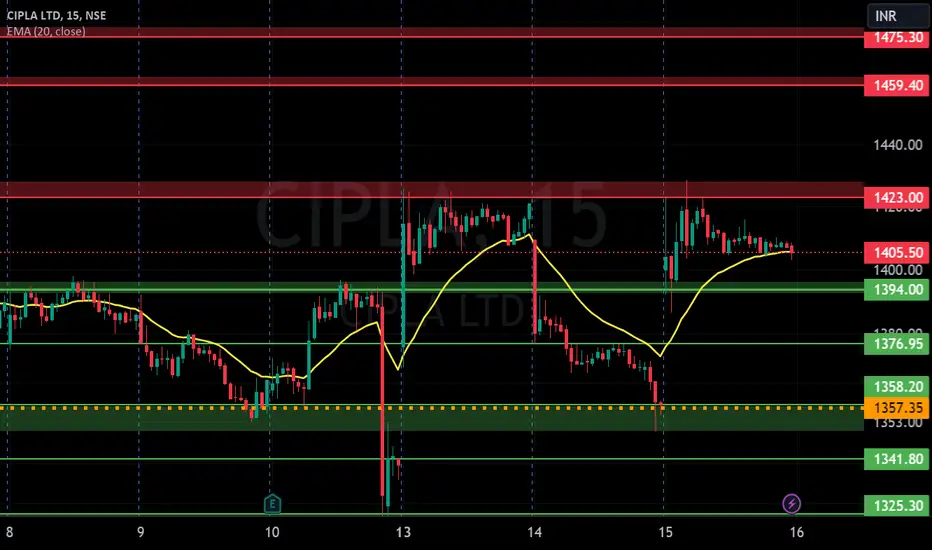
Cipla-Intraday 06.05.2024- Bulls, Are you ready?NSE:CIPLA
Day TF
Healthy Hammer candle formed in day
15 Min TF
Price is under consolidation which is very good sign for further movement
Price has rejected from support level.
Price has reacted well with 200 EMA & 50 EMA today.
Good Recovery after 10 AM
Buy:
Risky trader: Buy at 1428. Target 1%
Direct Gap-up entry should be avoided
Get confirmation from any of the leading indicators before entering trade
Kindy comment below in case of any clarification required on this particular idea.
Please follow for more ideas
“Confidence is not ‘I will profit on this trade.’ Confidence is ‘I will be fine if I don’t profit from this trade.” - Yvan Byeajee

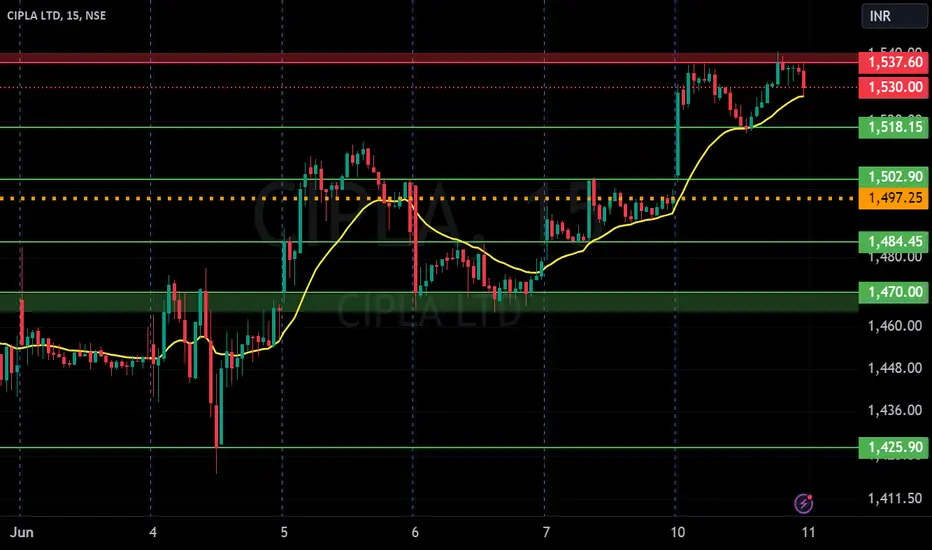
Cipla Intraday for 03.05.202415 Min TF
Trend: Sideways after upside breakout and again triple bottom and double top breakout.
Price is under consolidation which is very good sign for further movement
Many rejection candles founds in last hour which is sign of further movement upside
Price has strongly bounced from 200 EMA
Multiple rejection from breakout FVG
Bullish is trying to form. Good sign of bullish
Buy:
Risky trader: Buy at 1426. Target around 10 Points(0.7%)
Sell:
Sell below 1410. It should cross 50 EMA for entry. Target near to 200 EMA
Get confirmation from any of the leading indicators before entering trade
Kindy comment below in case of any clarification required. Please follow for more ideas
