What you think about Cipla?? uptrend?as per my chart analysis in cipla. it took support in static and dynamic . 1066 is SL and 1302 is target
CIPLA trade ideas

CIPLA LTD Support and ResistanceSupport and Resistance Levels: In technical analysis, support and resistance levels are significant price levels where buying or selling interest tends to be strong. They are identified based on previous price levels where the price has shown a tendency to reverse or find support.
Support levels are represented by the green line and green shade, indicating areas where buying interest may emerge to prevent further price decline.
Resistance levels are represented by the red line and red shade, indicating areas where selling pressure may arise to prevent further price increases. Traders often consider these levels as potential buying or selling opportunities.
Breakouts: Breakouts occur when the price convincingly moves above a resistance level (red shade) or below a support level (green shade). A bullish breakout above resistance suggests the potential for further price increases, while a bearish breakout below support suggests the potential for further price declines. Traders pay attention to these breakout signals as they may indicate the start of a new trend or significant price movement.
Disclosure: I am not SEBI registered. The information provided here is for learning purposes only and should not be interpreted as financial advice. It is important to consult with a qualified financial advisor before making any investment decisions. Tweets neither advice nor endorsement.

BEST OPPORTUNITY GOT IN 2023 ON CIPLA H4Using the Indicator Eagle Signal Pro, got wonderful opportunities to go short and long within the span of a period.
At First the Cipla is in a upward trend then started to comes down, sooner the indicator given the red sell signal to go for short position.
Later few days after a small consolidation. The price started to go upwards due to the positive impact on the market. again the indicator showed a Green Buy signal to go for a long position.
Both trades could result to a much amount of profit.
No any indicator can guarantee a 100% profitability. But with your research analysis and the help of this indicator can make you more profitable trader in the Indian Stock Market

Good time to buy Cipla?
Downswing seems to be over for Cipla. I think a new upswing should start from tomorrow, and we should take chance with it for 5-10%.

CIPLABreakout and Retest.
Surging volume can push the stock price.
Disclaimer : This is not a Buy or Sell recommendation. Please consult your financial advisor before making any investments . This is for Educational purpose only

Cipla Daily Chart Analysis Cipla is trading in a range from last 1 week if stock gives a breakout of this zone we will go long above 1465 with sl of 1400

Buy cipla 5.5% upside move possible Cipla give us good movement in past days and now it also give us breakout .
Buy cipla at 1412
Target 1505 1580 1650
Sl 1366

Possibility cipla will consolidate or fall few pointsNOTE: I am not a professional investor; I have only two years of experience in stocks and investing. Please refrain from making any trades based on my chart analysis, as this is solely for community learning purposes.

Long chance in CiplaAs per price actiom. CIPLA is looking for a weekly breakout. currently at retrace. once a positive move comes, we can see some big fat green candles. If falls down as wel, we willhave limited stoploss.

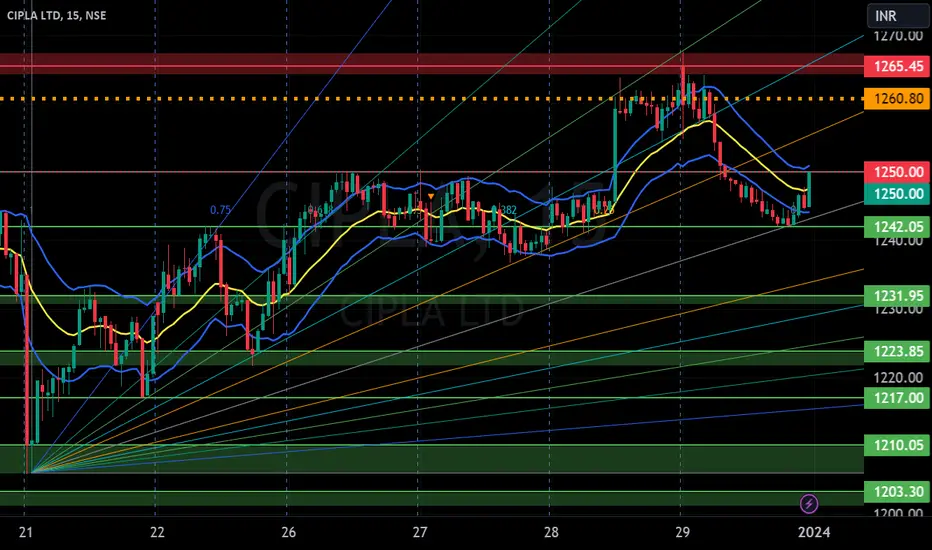
CIPLA S/R for 29/1/24Support and Resistance Levels:
Based on the price action, you have to identify two significant levels: the red line acting as resistance and the green line acting as support. Additionally, there have marked red and green shades to represent resistance and support zones, respectively.
Support: The green line and green shade represent support levels. These levels are where the price tends to find buying interest, preventing it from falling further. Traders can consider these levels as potential buying opportunities.
Resistance: The red line and red shade represent resistance levels. These levels are where the price tends to encounter selling pressure, preventing it from rising further. Traders can consider these levels as potential selling opportunities.
Breakouts: If the price breaks above the resistance zone (red shade) convincingly, it may indicate a bullish breakout, and the price could move higher to the next resistance level. On the other hand, if the price breaks below the support zone (green shade) convincingly, it may indicate a bearish breakout, and the price could move lower to the next support level.
Keltner Channel:
The Keltner Channel is a technical indicator that uses an exponential moving average (EMA) to create an upper and lower channel around the price action. Traders can use this channel to identify potential long and short positions.
Long Position: If the price is above the upper line of the Keltner Channel, it may indicate a potential long opportunity, as it suggests the price is trading above the average range and might continue in an upward trend.
Short Position: If the price is below the lower line of the Keltner Channel, it may indicate a potential short opportunity, as it suggests the price is trading below the average range and might continue in a downward trend.

Buy signal in Cipla
Upside swing seem to have started in Cipla , i think it is right time to buy it for coupel of months or around 10% whichever comes first.

CIPLAtrend identification =previous trend 855 to 1270 strong uptrend. next 8 AUG 23 to 2 JAN 24 consolidation (ASCENDING triangle). next uptrend.
1.ascending triangle
2.previous trend is UPTREND
3.volume = GOOD
4.line breakout
5. target = 1440.


Cipla These are swing ideas which you can add your watchlist and analysis for yourself !
Keep on your radar!
This I am not sebi ragister I

CIPLA IS UP TRENDtrend identification =previous trend 855 ta 1270 strong uptrend. next 8 AUG 23 to 2 JAN 24 consolidation (symmetrical triangle). next I think uptrend.
1.symmeyrical triangle
2.previous trend is UPTREND
3.volume = no
4.line breakout
5. target = 1440.


CIPLA S/R for 3/1/24Support and Resistance Levels:
Based on the price action, you have to identify two significant levels: the red line acting as resistance and the green line acting as support. Additionally, there have marked red and green shades to represent resistance and support zones, respectively.
Support: The green line and green shade represent support levels. These levels are where the price tends to find buying interest, preventing it from falling further. Traders can consider these levels as potential buying opportunities.
Resistance: The red line and red shade represent resistance levels. These levels are where the price tends to encounter selling pressure, preventing it from rising further. Traders can consider these levels as potential selling opportunities.
Breakouts: If the price breaks above the resistance zone (red shade) convincingly, it may indicate a bullish breakout, and the price could move higher to the next resistance level. On the other hand, if the price breaks below the support zone (green shade) convincingly, it may indicate a bearish breakout, and the price could move lower to the next support level.
Keltner Channel:
The Keltner Channel is a technical indicator that uses an exponential moving average (EMA) to create an upper and lower channel around the price action. Traders can use this channel to identify potential long and short positions.
Long Position: If the price is above the upper line of the Keltner Channel, it may indicate a potential long opportunity, as it suggests the price is trading above the average range and might continue in an upward trend.
Short Position: If the price is below the lower line of the Keltner Channel, it may indicate a potential short opportunity, as it suggests the price is trading below the average range and might continue in a downward trend.
Disclosure: I am not SEBI registered. I just wanted to let you know that the information provided here is for learning purposes only. Please consult your financial advisor before making any decisions. Tweets neither advice nor endorsement.

CIPLA S/R for 1/1/24Support and Resistance Levels:
Based on the price action, you have to identify two significant levels: the red line acting as resistance and the green line acting as support. Additionally, there have marked red and green shades to represent resistance and support zones, respectively.
Support: The green line and green shade represent support levels. These levels are where the price tends to find buying interest, preventing it from falling further. Traders can consider these levels as potential buying opportunities.
Resistance: The red line and red shade represent resistance levels. These levels are where the price tends to encounter selling pressure, preventing it from rising further. Traders can consider these levels as potential selling opportunities.
Breakouts: If the price breaks above the resistance zone (red shade) convincingly, it may indicate a bullish breakout, and the price could move higher to the next resistance level. On the other hand, if the price breaks below the support zone (green shade) convincingly, it may indicate a bearish breakout, and the price could move lower to the next support level.
Keltner Channel:
The Keltner Channel is a technical indicator that uses an exponential moving average (EMA) to create an upper and lower channel around the price action. Traders can use this channel to identify potential long and short positions.
Long Position: If the price is above the upper line of the Keltner Channel, it may indicate a potential long opportunity, as it suggests the price is trading above the average range and might continue in an upward trend.
Short Position: If the price is below the lower line of the Keltner Channel, it may indicate a potential short opportunity, as it suggests the price is trading below the average range and might continue in a downward trend.
Disclosure: I am not SEBI registered. I just wanted to let you know that the information provided here is for learning purposes only. Please consult your financial advisor before making any decisions. Tweets neither advice nor endorsement.
CIPLA Support and Resistance Support and Resistance Levels:
Based on the price action, you have to identify two significant levels: the red line acting as resistance and the green line acting as support. Additionally, there have marked red and green shades to represent resistance and support zones, respectively.
Support: The green line and green shade represent support levels. These levels are where the price tends to find buying interest, preventing it from falling further. Traders can consider these levels as potential buying opportunities.
Resistance: The red line and red shade represent resistance levels. These levels are where the price tends to encounter selling pressure, preventing it from rising further. Traders can consider these levels as potential selling opportunities.
Breakouts: If the price breaks above the resistance zone (red shade) convincingly, it may indicate a bullish breakout, and the price could move higher to the next resistance level. On the other hand, if the price breaks below the support zone (green shade) convincingly, it may indicate a bearish breakout, and the price could move lower to the next support level.
Keltner Channel:
The Keltner Channel is a technical indicator that uses an exponential moving average (EMA) to create an upper and lower channel around the price action. Traders can use this channel to identify potential long and short positions.
Long Position: If the price is above the upper line of the Keltner Channel, it may indicate a potential long opportunity, as it suggests the price is trading above the average range and might continue in an upward trend.
Short Position: If the price is below the lower line of the Keltner Channel, it may indicate a potential short opportunity, as it suggests the price is trading below the average range and might continue in a downward trend.
Disclosure: I am not SEBI registered. I just wanted to let you know that the information provided here is for learning purposes only. Please consult your financial advisor before making any decisions. Tweets neither advice nor endorsement.

CIPLAStock trading above 100 DMA as well as above 20℅ reverse from last 6 month Low ,
It's Bullish sing

CIPLA
I am not SEBI register Advisor and I am not any trade and tips recommend here, This Idea post on this Channel Only for educational knowledge & learning purpose, I am not provide any trading tips, Before any Trade Advice your Financial Advisor, I am not responsible any profit and loss

CIPLA--Head and shoulders Pattern??A strong Bearish pressure is observed in this stock recently.
On bottom side we have a bullish gap left below at 1060 zone.
A left shoulder is formed at 1230 zone.
we have a chance of right shoulder formation, if a rise is from 1135 at neckline...
then we have a chance of break below the neckline to reach, the bullish gap. wait for the price to break the neckline and retest then will go for complete short side.
Keep in short side in this stock.

🚀 Seizing Opportunities: Cipla's High-Reward Trade Potential!Embark on a journey into the charts of Cipla as we uncover a compelling trade opportunity, breaking down the analysis in simple terms for both new and experienced traders.
Current Market Dynamics 📊:
LTF (75 min): Cipla is currently positioned within the 75-min demand zone, characterized by a Rally Base Rally (RBR) structure.
ITF (Daily): The daily time frame indicates an upward trend at price trading at 20 EMA, a sideways movement when considering smaller swing levels.
HTF (Weekly): Zooming out to the weekly chart, there's a clear absence of resistance, setting the stage for potential bullish movements.
Trade Strategy 📈:
Zone Analysis: The 75-min demand zone is robust and presents a prime opportunity for a low-risk, high-reward trade.
Risk-Reward Ratio: Planning for a Risk-to-Reward Ratio of 1:4, ensuring a favourable balance between risk and potential profit.
Why This Trade Stands Out 🌟:
The 75-min demand zone serves as a stronghold for potential price movements.
The daily trend, Price trading at Daily EMA 20.
A lack of resistance on the weekly chart provides a favourable backdrop for an upward trajectory.
Final Considerations 🚀:
Cipla's current positioning offers not just a good trade but a high-reward opportunity. With a focus on the strong demand zone and a promising risk-reward ratio, this trade deserves attention.
Trade Smart, Trade Confidently! 💹✨
Disclaimer 🚨:
This analysis is for educational purposes only. I am not a SEBI registered analyst. Trade responsibly.
