Cup of Coffee with COAL INDIA CUP OF COFFEE ☕ Getting READY with Real COAL taste it for big GOAL
Handle formation is pending.
Right time to Catch it (My Personal view).
Regular Dividend payer.
Do Your analysis from your side, to make it more tastier.
COALINDIA trade ideas
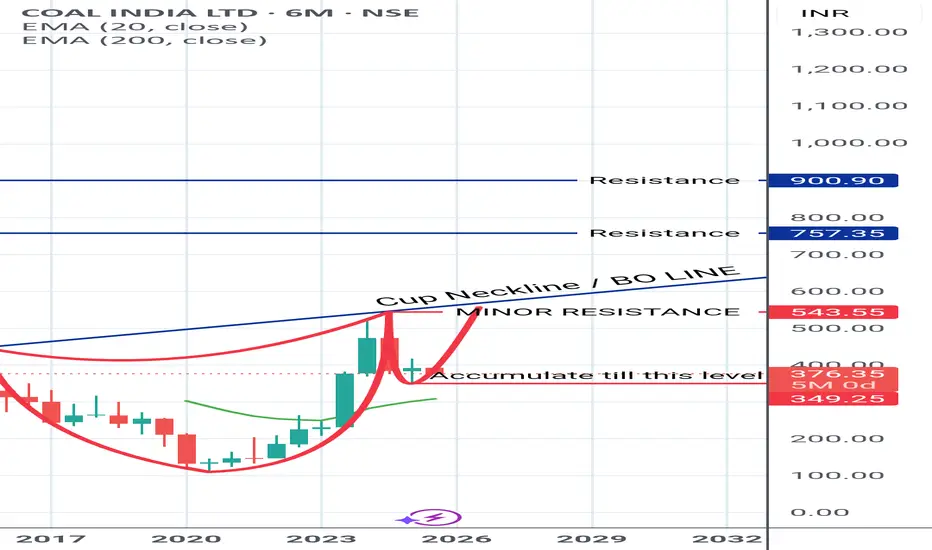
Coal India CUP & HANDLE Pattern formation going on Coal India currently forming a CUP & Handle pattern ,Breakout of this pattern will be above 410 level .Target price will be arround 470 level .One can start accumulation in Coal India .Stoploss will be arround 360 level
COAL INDIA LTD - DON'T MISS.Everything is pretty much explained in the picture itself.
I am Abhishek Srivastava | SEBI-Certified Research and Equity Derivative Analyst from Delhi with 4+ years of experience.
I focus on simplifying equity markets through technical analysis. On Trading View, I share easy-to-understand insights to help traders and investors make better decisions.
Kindly check my older shared stock results on my profile to make a firm decision to invest in this.
Kindly dm for further assistance it is for free just for this stock.
Thank you and invest wisely.

COAL INDIA🎯 Trade Plan – Positional Buy
Parameter Value
Entry ₹383
Stop Loss ₹375
Risk ₹8
Target ₹738
Reward ₹355
R:R 44.4x
Last High ₹544
Last Low ₹350
✅ Key Technical Highlights
✅ All Timeframes Aligned Bullish – strong confluence across HTF, MTF, and ITF.
✅ Entry Zone Overlaps: Monthly, Qtrly, Half-Yearly all cluster at ₹383–375.
✅ Microstructure Support: Strong base formation at ₹375 confirmed by all intraday frames.
✅ Breakout Confirmation: Quarterly candle breakout further strengthens bullish case.
✅ Excellent R:R – Minor risk with exponential potential.
🧠 Execution Strategy
Entry Range: ₹383–380 (on minor retracement).
SL: ₹375 (below base of zone).
Initial Target: ₹544 (last swing high) – partial booking.
Final Target: ₹738 (based on HTF extension).
Trail aggressively post ₹450 to lock profits.
⚠️ Things to Monitor
Volume confirmation near ₹390–400 zone.
If ₹375 breaks with strength, reassess setup.
🧾 Verdict:
Grade-A High Probability Trade with minimal risk and multi-timeframe support. Strong structure, breakout confirmation, and institutional demand zones make this a compelling buy setup.
🔹 COAL INDIA – Multi-Timeframe Trade Setup (Refined)
🔸 Overall Structure: Strong Bullish Setup
Timeframe Trend Demand Zone Type Zone (₹) Avg Price
Yearly UP BUFL 256 – 208 232
Half-Yearly UP BUFL 383 – 375 379
Quarterly UP BUFL + Breakout 383 – 375 379
HTF Avg UP — 341 – 319 330
| Monthly | UP | RALLY-RALLY | 383 – 375 | 379 |
| Weekly | UP | DMIP | 372 – 342 | 357 |
| Daily | UP | BUFL / DMIP | 368 – 342 | 355 |
| MTF Avg | UP | — | 374 – 353 | 364 |
| 240M/180M/60M | UP | DMIP | ~375 – 373 | 375 |

Coal India Ltd view for Intraday 21st May #COALINDIA Coal India Ltd view for Intraday 21st May #COALINDIA
Resistance 410 Watching above 411 for upside momentum.
Support area 400 Below 405 ignoring upside momentum for intraday
Watching below 399 for downside movement...
Above 405 ignoring downside move for intraday
Charts for Educational purposes only.
Please follow strict stop loss and risk reward if you follow the level.
Thanks,
V Trade Point

Coal India May Touch Green Line Soon....Coal india (COALINDIA) Is in Uptrend and uska next Target 427 tak ho sakta hai...
Be Ready with ur capital

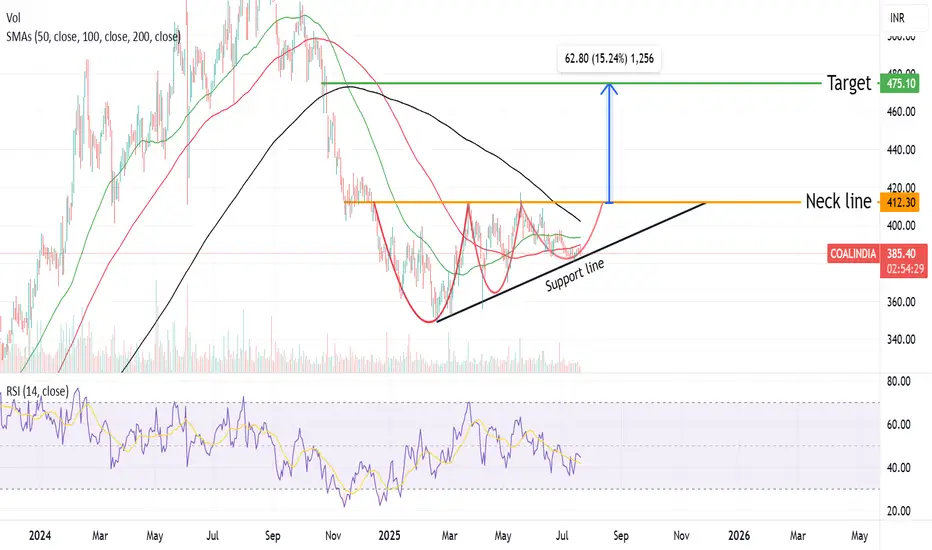
Coal India - BreakoutNSE:COALINDIA is good Breakout. If this crosses 408 and sustains, this can go till 420 and it's safe to book profits at this Level. If you are ready for Risk Reward, you cna put trailing stop loss at 420 and Target for 450.

Coal India Ltd view for Intraday 8th May #COALINDIA Coal India Ltd view for Intraday 8th May #COALINDIA
Resistance 385 Watching above 386 for upside movement...
Support area 380 Below 380 ignoring upside momentum for intraday
Watching below 379 for downside movement...
Above 385 ignoring downside move for intraday
Charts for Educational purposes only.
Please follow strict stop loss and risk reward if you follow the level.
Thanks,
V Trade Point

Review and plan for 8th May 2025 Nifty future and banknifty future analysis and intraday plan.
Quarterly results.
This video is for information/education purpose only. you are 100% responsible for any actions you take by reading/viewing this post.
please consult your financial advisor before taking any action.
----Vinaykumar hiremath, CMT

COALINDIA : Positioned for a BreakoutCOAL INDIA LTD (COALINDIA): Consolidation and Potential Reversal 🌟
Price Action Overview:
Current price: ₹414.05 , trading near a key consolidation zone.
A deep retracement zone has been identified between ₹374–₹394 , where buyers are likely to dominate.
Liquidity building in this range may act as a trigger for a reversal.
Key Levels:
Deep Retracement Zone: ₹374–₹394
A critical demand area for long entries.
Stop Loss: ₹360 (Hourly close below invalidates the demand zone and trade setup).
First Target Zone: ₹513 (Historical resistance where profit booking is likely).
Trading Strategy:
Entry Plan:
Look for buying opportunities within the ₹374–₹394 range, provided bullish price action confirms (e.g., volume spikes, bullish engulfing, or reversal candlestick patterns).
Stop Loss:
Place a stop loss below ₹360 to cap downside risk.
Profit Target:
First target: ₹513 .
Scale out of the position or use trailing stops as the price approaches this zone to maximize gains.
Alternate Scenario:
If demand fails in the ₹374–₹394 zone, anticipate a deeper retracement. Avoid entering the trade in such a scenario.
Potential Risks:
Failure to sustain buying interest in the demand zone could lead to further bearish momentum.
Broader commodity sector trends may impact Coal India's price movement.
Disclaimer:
This analysis is for educational purposes only. I am not a SEBI-registered analyst. Please conduct your research or consult with a financial advisor before trading.
#CoalIndia #TechnicalAnalysis #DeepRetracement #SwingTrading #StockMarket #TradingStrategy #MarketInsights #Nifty50 #BSE #NSE #StocksToWatch #Fibonacci

COAL INDIA 1D TFNSE:COALINDIA has been bearish for a long time and now is retracing. The bearish run could continue if the stock breaks the demand zone with a strong bearish candle and a good volume. Recently Coal India has invested in creating a solar power plant.This news could even disrupt the bearish run.But if the stock breaks the demand zone, the stock could be expected to move to the next lower demand zone.
Disclaimer:- This analysis is only for educational purpose. Please always do your own analysis or consult with your financial advisor before taking any kind of trades

Coal India : Bullish viewWe could expect some reversal from the marked area. Wait for the reversal before entry.
Chart is shared only for the educational purpose.

Watch COAL INDIA below 475Coal India has formed a beraish head and shoulders pattern below 475 we can expect bearish phase.

COALINDIA Q2 FY24 Earnings Report: Slowing Growth but Dividend P🔴 COALINDIA Q2 FY24 Earnings Report: Slowing Growth but Dividend Play Ahead 🔴
Overview: COALINDIA Q2 FY24 results, announced on October 25 after market close, reveal a slowing growth trajectory with YoY declines in profit and revenue. Although the company remains profitable, the market sentiment may be dampened by these lower earnings.
Earnings Summary:
Net Profit: ₹6,289 crore, down 21.9% YoY (compared to ₹8,048.6 crore last year)
Revenue: ₹30,672.9 crore, down 6.4% YoY
EBITDA: ₹8,617 crore, down 14.2% YoY, with a margin of 28.1%
Interim Dividend: ₹15.75/share announced, Record Date: November 1, 2024
Technical Levels:
Current Price: ₹461 (as of October 25 close)
Resistance Levels: ₹507, ₹496, ₹486, ₹475
Support Levels: ₹456, ₹436, ₹426, ₹405, ₹375
Suggested Trading Strategy
While COALINDIA’s earnings reflect slowing growth, the stock remains attractive due to the high dividend payout. Here’s a balanced approach:
Sell on Rise: The weak earnings growth suggests potential selling pressure. Consider reducing positions if the stock tests upper resistance levels (₹475-₹507).
Dividend Strategy: Muhurat trading on November 1 (Diwali) offers a unique buy opportunity for dividend eligibility through the T+1 settlement system. Entering near support levels around ₹456 could allow for dividend capture by the November 5 settlement.
Conclusion: The focus remains on capturing dividend benefits during Muhurat trading while monitoring for price dips to support levels. Despite lower YoY performance, Coal India’s profitability and dividend yield make it viable for strategic positioning.
Disclaimer: I am not a SEBI-registered advisor. This analysis is for educational and informational purposes only and should not be construed as financial advice. Please conduct your own research or consult with a SEBI-registered investment advisor before making any investment decisions. Trading and investing in the stock market involves risks, and you should assess these risks based on your financial situation and risk tolerance.

Coal India Q2 FY24 Earnings Report: Slowing Growth but Dividend 🔴 NSE:COALINDIA Q2 FY24 Earnings Report: Slowing Growth but Dividend Play Ahead 🔴
Overview: NSE:COALINDIA Q2 FY24 results, announced on October 25 after market close, reveal a slowing growth trajectory with YoY declines in profit and revenue. Although the company remains profitable, the market sentiment may be dampened by these lower earnings.
Earnings Summary:
Net Profit: ₹6,289 crore, down 21.9% YoY (compared to ₹8,048.6 crore last year)
Revenue: ₹30,672.9 crore, down 6.4% YoY
EBITDA: ₹8,617 crore, down 14.2% YoY, with a margin of 28.1%
Interim Dividend: ₹15.75/share announced, Record Date: November 1, 2024
Technical Levels:
Current Price: ₹461 (as of October 25 close)
Resistance Levels: ₹507, ₹496, ₹486, ₹475
Support Levels: ₹456, ₹436, ₹426, ₹405, ₹375
Suggested Trading Strategy
While NSE:COALINDIA ’s earnings reflect slowing growth, the stock remains attractive due to the high dividend payout. Here’s a balanced approach:
Sell on Rise: The weak earnings growth suggests potential selling pressure. Consider reducing positions if the stock tests upper resistance levels (₹475-₹507).
Dividend Strategy: Muhurat trading on November 1 (Diwali) offers a unique buy opportunity for dividend eligibility through the T+1 settlement system. Entering near support levels around ₹456 could allow for dividend capture by the November 5 settlement.
Conclusion: The focus remains on capturing dividend benefits during Muhurat trading while monitoring for price dips to support levels. Despite lower YoY performance, Coal India’s profitability and dividend yield make it viable for strategic positioning.
Disclaimer: I am not a SEBI-registered advisor. This analysis is for educational and informational purposes only and should not be construed as financial advice. Please conduct your own research or consult with a SEBI-registered investment advisor before making any investment decisions. Trading and investing in the stock market involves risks, and you should assess these risks based on your financial situation and risk tolerance.


EXPECTING UPSIDE MOVE IF ITS BREAKOUT 543 RANGEExpecting breakout the above mentioned range. if its breakout can expect good rally.

Coal India bullish swing expectedCoal India is a potential stock which can breakout & can give a good move. Its trading at its resistance on daily time frame.
If breaks resistance then min expectation will be 600.
its a under valued stock having a P.E 8.97 so can be preffered for long term investment also.
Disclaimer: Any of my posts should not be considered as a Buy/ Sell/Hold recommendation. This analysis is for educational and learning purpose only.
I always recommend using Stop Loss and following risk management rules.

Symmetrical Triangle Pattern in COALINDIAStock: COALINDIA
Timeframe: 1 Hour
Pattern: Symmetrical Triangle Breakout
Analysis:
Breakout: COALINDIA has given a breakout from a symmetrical triangle pattern.
Expectations: After this breakout, a bullish rally is anticipated.
Targets:
First Target: 542
Second Target: 555
Third Target: 570+
Stop Loss: Set at 520
Trading Strategy: Consider going long on COALINDIA, keeping a strict stop loss at 520.

COAL INDIA LTD S/R Support and Resistance Levels:
Support Levels: These are price points (green line/share) where a downward trend may be halted due to a concentration of buying interest. Imagine them as a safety net where buyers step in, preventing further decline.
Resistance Levels: Conversely, resistance levels (red line/shade) are where upward trends might stall due to increased selling interest. They act like a ceiling where sellers come in to push prices down.
Breakouts:
Bullish Breakout: When the price moves above resistance, it often indicates strong buying interest and the potential for a continued uptrend. Traders may view this as a signal to buy or hold.
Bearish Breakout: When the price falls below support, it can signal strong selling interest and the potential for a continued downtrend. Traders might see this as a cue to sell or avoid buying.
20 EMA (Exponential Moving Average):
Above 20 EMA: If the stock price is above the 20 EMA, it suggests a potential uptrend or bullish momentum.
Below 20 EMA: If the stock price is below the 20 EMA, it indicates a potential downtrend or bearish momentum.
Trendline: A trendline is a straight line drawn on a chart to represent the general direction of a data point set.
Uptrend Line: Drawn by connecting the lows in an upward trend. Indicates that the price is moving higher over time. Acts as a support level, where prices tend to bounce upward.
Downtrend Line: Drawn by connecting the highs in a downward trend. Indicates that the price is moving lower over time. It acts as a resistance level, where prices tend to drop.
Disclaimer:
I am not a SEBI registered. The information provided here is for learning purposes only and should not be interpreted as financial advice. Consider the broader market context and consult with a qualified financial advisor before making investment decisions.

Coal India Ltd - Approaching Breakout LevelCoal India is nearing a crucial resistance level at 543.00. A breakout above this level could signal a strong bullish move. The stock has been following an ascending trend line, showing consistent upward momentum. Watch for a potential breakout and follow the trend for trading opportunities.

COALINDIA: Bullish Breakout with Strong Momentum
Breakout from resistance at 527
Strong uptrend from Aug 2023
Ascending trend line
Strong volume support

Intraday Stock selectionin COALINDIA 538.70 is the major resistance zone, today most of the big players are present in this stock. Entry was at 10.05 candle with the price of 536.15 and the SL at538.80. expecting 1:3RR in this trade. with the target of days low.
